


On August 13, 2026, TSS Inc (ticker: TSSI) released its second-quarter financial results, delivering a mixed performance that highlights ongoing challenges in revenue growth and valuation. Despite beating earnings per share expectations, the company’s revenue declined sharply year-over-year and missed consensus forecasts by a wide margin.
- TSSI’s current Price-to-Sales (P/S) ratio of 1.57x is significantly elevated compared to its historical median of 0.4x and industry norms, signaling that the market is pricing in substantial future growth despite the company’s unprofitable and cash-flow-negative status, rendering earnings-based valuation metrics like P/E less relevant.
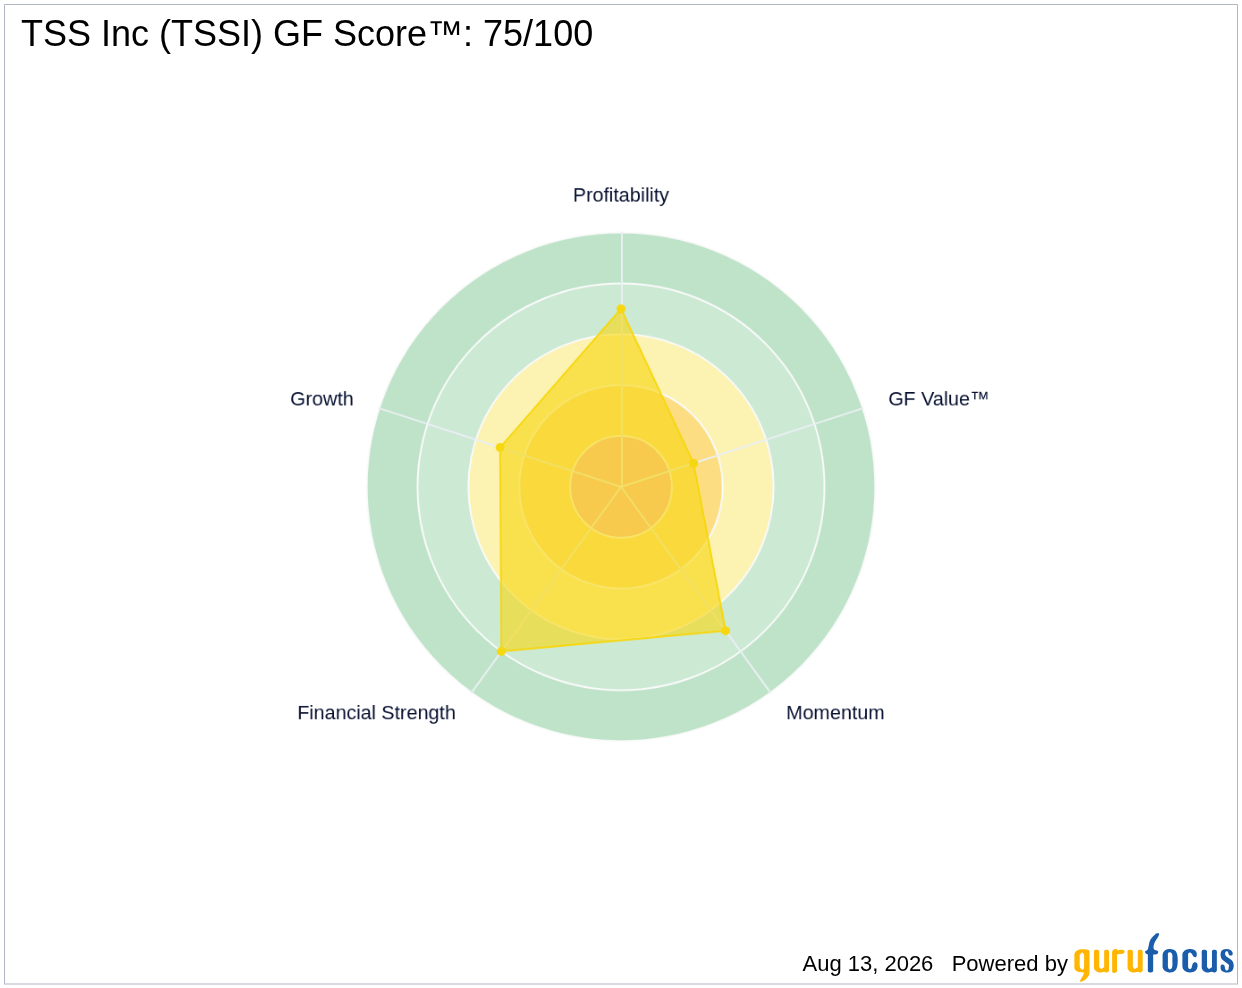
- The company’s GF Score™ stands at a solid 75 out of 100, reflecting strong financial strength and momentum but moderate growth and valuation concerns.
- Insider activity shows notable selling with no insider purchases in the past three months, totaling $4.9 million in shares sold, while only one guru currently holds TSSI with two gurus trimming positions recently, indicating cautious sentiment among informed investors.
What's Behind the News?
TSS Inc reported a GAAP EPS of $0.05 for Q2 2026, beating estimates by $0.02 per share, but revenue fell 20.1% year-over-year to $35.14 million, missing expectations by $9.57 million. The company attributes optimism to a stronger second half driven by growth in its Systems Integration segment and reaffirmed its full-year Adjusted EBITDA guidance of $20 million to $22 million. This outlook suggests management’s confidence in operational improvements despite recent top-line softness.
Operating within the Technology sector and Software industry, TSS Inc specializes in integrating complex Artificial Intelligence (AI) technologies and managing mission-critical infrastructure for data centers, operations centers, and communications facilities. With a market capitalization of $336 million, the company offers a broad suite of services including technology consulting, design, engineering, project management, and IT procurement. Its high beta of 4.16 underscores the stock’s volatility relative to the market.
Is TSSI Overvalued on a Price-to-Sales Basis?
TSSI’s trailing twelve months Price-to-Sales ratio stands at 1.57x, which is nearly four times its five-year median P/S of approximately 0.4x. This elevated valuation implies that investors are pricing in significant future revenue growth despite the company’s recent 20.1% revenue decline and ongoing unprofitability. Given TSSI’s negative free cash flow and earnings volatility, traditional earnings-based valuation metrics such as the P/E ratio (currently 24.41x trailing but with a forward P/E of 45.16x) are less meaningful for assessing intrinsic value. The market appears to be betting on a turnaround driven by growth in Systems Integration and operational leverage.
GuruFocus’ proprietary GF Value™ metric estimates TSSI’s intrinsic value at $7.96 per share, which is 50.3% below the current market price of $11.96. While GF Value™ is a useful directional indicator, it relies heavily on historical multiples and growth assumptions that may not fully capture the company’s evolving business model or near-term challenges. Investors should interpret this “Significantly Overvalued” label as a cautionary signal rather than a precise price target. For more details, see GF Value™.
What Does TSSI's GF Score™ Tell Us?
The GF Score™ aggregates multiple dimensions of a company’s financial health, including profitability, growth, financial strength, valuation, and momentum, into a single composite rating. TSSI’s GF Score™ of 75/100 indicates a generally solid profile, with particular strengths in financial stability and market momentum, but some weaknesses in valuation and moderate growth metrics.
| Metric | Rating (out of 10) |
|---|---|
| GF Score™ | 75 |
| Financial Strength | 8 |
| Profitability | 7 |
| Growth | 5 |
| Valuation | 3 |
| Momentum | 7 |
TSSI’s strongest areas are its financial strength and momentum, supported by a robust Altman Z-Score of 4.19 and a current ratio of 2.18, indicating solid liquidity and low bankruptcy risk. Profitability metrics such as a 7.14% net margin and 30.34% return on equity also contribute positively. However, the company’s valuation rank of 3/10 reflects the market’s premium pricing relative to fundamentals, and growth is moderate with a rank of 5/10 despite a strong 3-year revenue growth rate of 80.8%. Investors should weigh these mixed signals carefully. More details can be found on the TSSI stock page.
What Are Gurus and Insiders Doing with TSSI?
GuruFocus tracks that only one premium guru currently holds TSSI, with no recent additions but two gurus trimming their positions in recent quarters. This cautious stance among top institutional investors suggests skepticism about the company’s near-term prospects or valuation. Insider activity corroborates this sentiment: over the past three months, insiders have sold approximately $4.9 million worth of shares with no insider purchases reported. This net selling trend may indicate a lack of confidence from management and insiders in the stock’s current price level or growth outlook.
What This Means for Investors
TSSI’s valuation profile, particularly its elevated Price-to-Sales ratio and GF Value™ indicating a 50.3% overvaluation, suggests that the market is pricing in aggressive future growth that has yet to materialize amid recent revenue declines and negative free cash flow. Earnings-based valuation metrics are unreliable here due to the company’s unprofitable status, making P/S a more relevant gauge of market expectations. The combination of insider selling and guru trimming further signals caution among informed investors. While TSSI’s strong financial strength and momentum provide some support, the valuation premium and operational headwinds warrant careful scrutiny. Investors interested in TSSI should monitor upcoming quarterly results and operational execution closely. For ongoing updates and detailed financial data, visit the TSSI stock page.
Frequently Asked Questions
What is TSSI's GF Score™?
TSSI’s GF Score™ is 75 out of 100, reflecting a solid overall financial profile with strengths in financial stability and momentum, but moderate growth and valuation concerns.
Is TSSI overvalued or undervalued?
Based on Price-to-Sales, TSSI appears significantly overvalued relative to its historical median and industry peers. Earnings-based valuation metrics like P/E are not meaningful due to the company’s unprofitable and cash-flow-negative status.
What is TSSI's P/E ratio compared to historical?
TSSI’s trailing P/E ratio is 24.41x, below its five-year median of 34x, but the forward P/E is higher at 45.16x. However, given the company’s earnings volatility and losses, P/E ratios are less informative than other metrics such as financial strength and Price-to-Sales.
This stock alert was generated using automated technology and GuruFocus financial data to provide readers with timely and accurate market reporting. This content was reviewed by GuruFocus editorial team prior to publication. Please send any questions or comments about this story to [email protected].

