


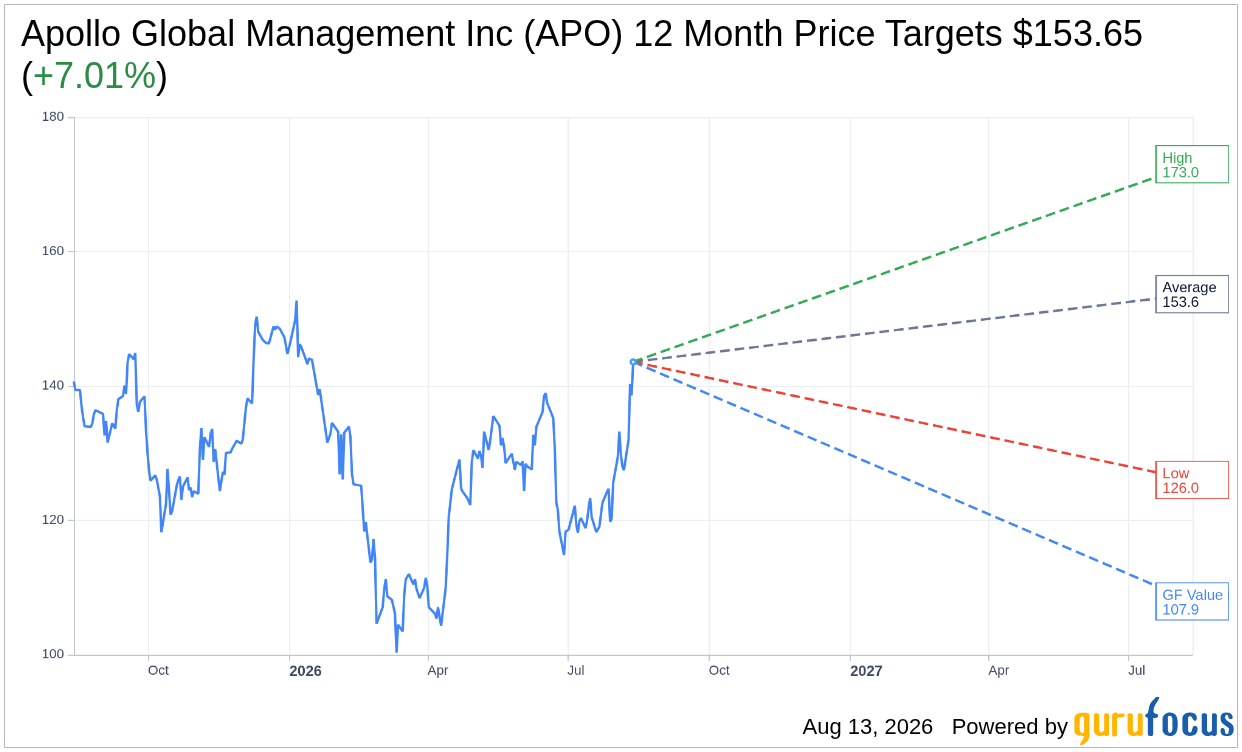
On August 13, 2026, Apollo Global Management Inc APO shares rose 3.6% to a current price of $143.58. The stock has experienced a notable 52-week range, hitting a high of $153.29 and a low of $99.56.
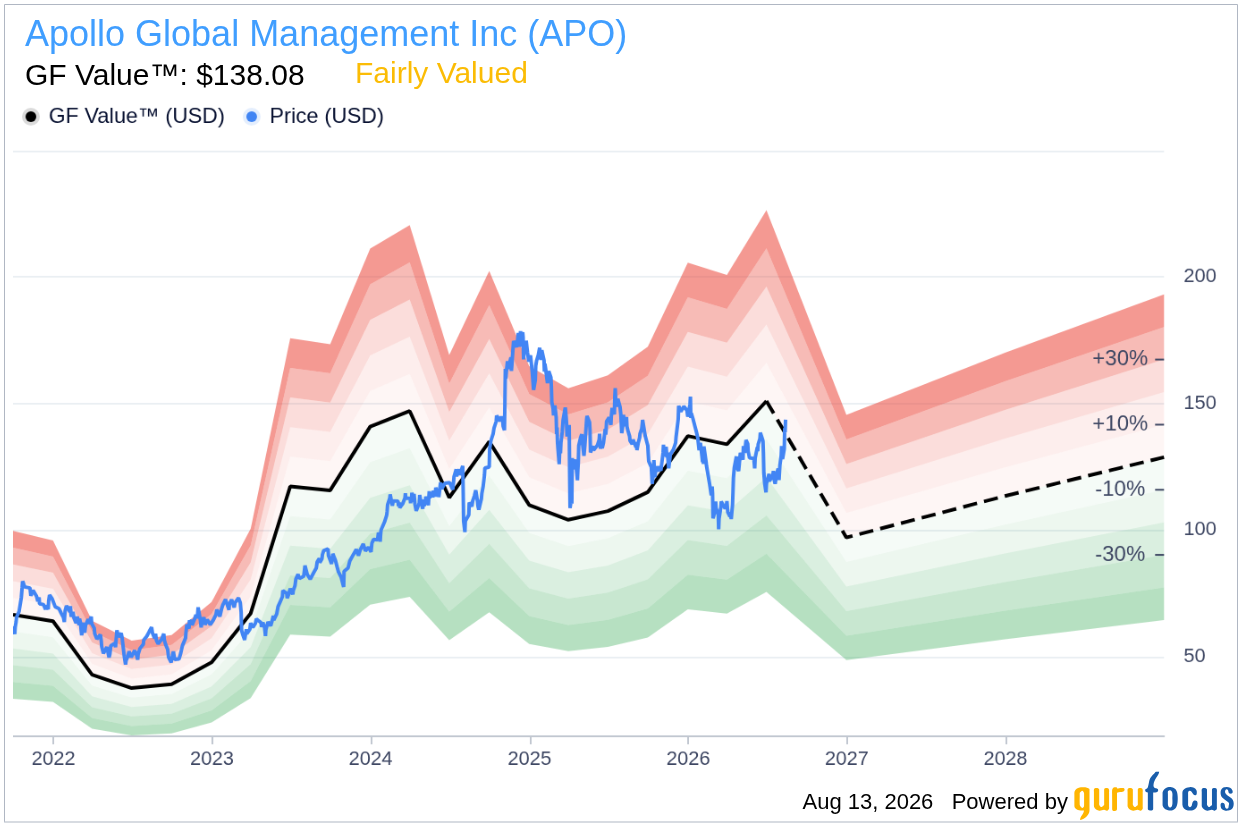
- GF Value™ verdict: Current price is $143.58 vs GF Value of $138.08, indicating the stock is 4.0% overvalued.
- GF Score™ is 75/100, reflecting above average performance relative to peers.
- Most notable signal: Insider activity shows $7.3M in sales over the last 3 months with no buying.
Is APO Overvalued or Undervalued?
Based on the current price of $143.58 and the GF Value™ estimate of $138.08, Apollo Global Management Inc appears to be slightly overvalued, with a margin of safety of -4.0%. GF Value™ is GuruFocus' proprietary estimate of intrinsic value that takes into account historical trading multiples, company growth, and future performance forecasts. The GF Valuation label indicates that the stock is fairly valued, but with the current price surpassing the GF Value™, it suggests a risk of potential price correction.
The overvaluation implies that there may be limited upside potential in the near term. Investors may need to exercise caution, as the stock trades above its estimated fair value, which could indicate that the recent price appreciation is not fully supported by underlying fundamentals.
How Does APO's Valuation Compare to Its History?
| Metric | Current | Historical |
|---|---|---|
| P/E (TTM) | 52.6x | 17.3x |
| Forward P/E | 16.3x | N/A |
The current P/E ratio of 52.6x is significantly above its 5-year median of 17.3x, suggesting that the stock is trading at a much higher valuation compared to its historical averages. This analysis aligns with the GF Value™ verdict, confirming that the stock is indeed overvalued.
What Does APO's GF Score™ Tell Us?
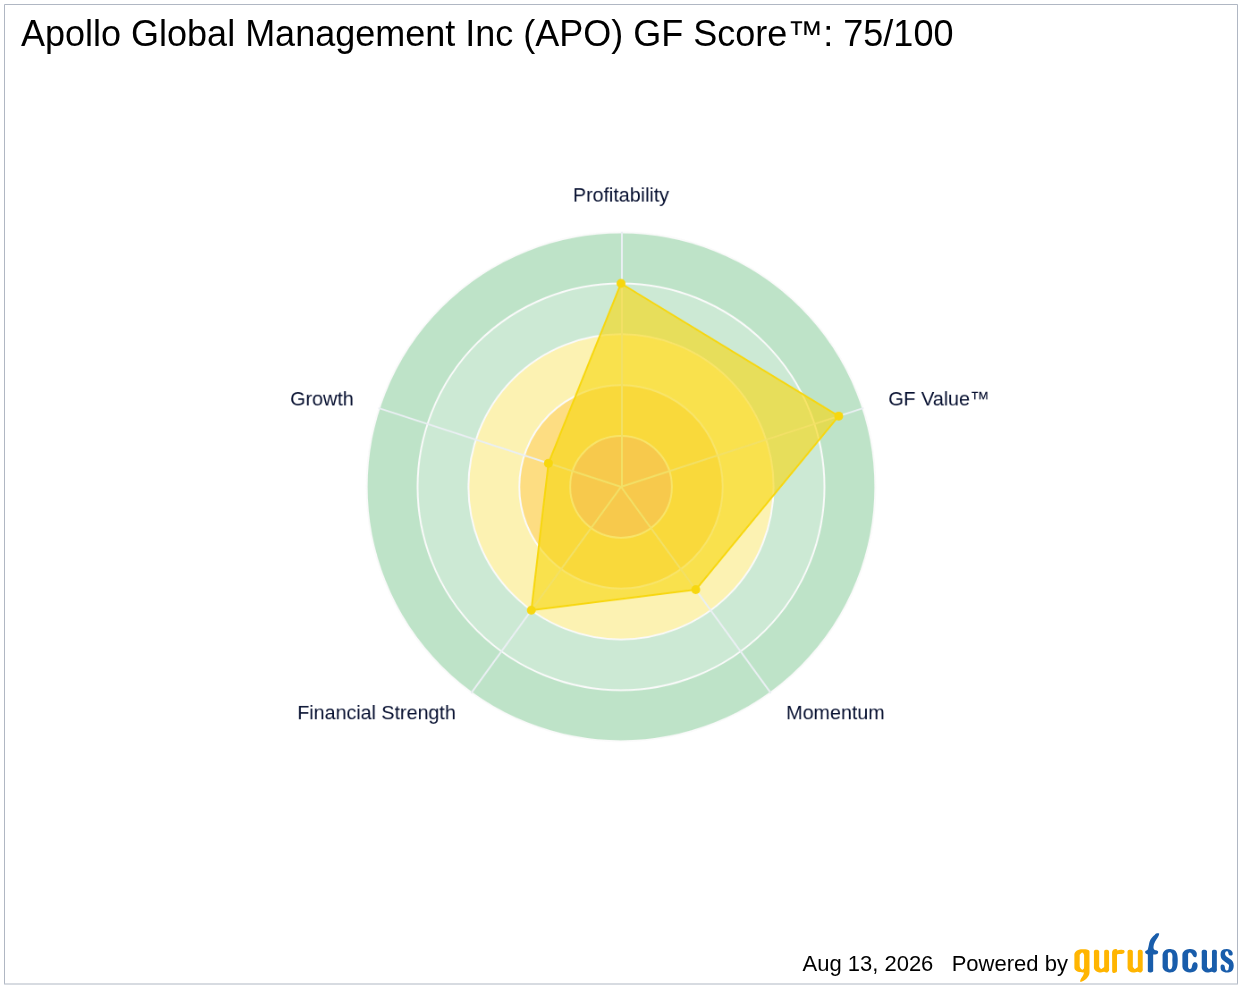
The GF Score™ evaluates a company's performance across various dimensions including financial strength, profitability, growth, valuation, and momentum. Apollo Global Management Inc has a GF Score™ of 75/100, indicating a solid performance relative to its peers, but with some notable weaknesses in certain areas.
| Metric | Rating |
|---|---|
| GF Score™ | 75 |
| Financial Strength | 6/10 |
| Profitability | 8/10 |
| Growth | 3/10 |
| Valuation | 9/10 |
| Momentum | 5/10 |
The strongest area for APO is its profitability rank at 8/10, indicating strong profit margins and returns on equity. However, the growth rank of 3/10 reveals that the company’s growth prospects may be limited relative to competitors. The valuation rank of 9/10 suggests that while the company has favorable valuation metrics, the current P/E ratio indicates a deviation from typical performance, aligning with the overvalued status.
What Are Gurus and Insiders Doing with APO?
A total of 15 gurus currently hold shares of Apollo Global Management Inc, with 9 adding to their positions and 3 trimming their holdings in recent quarters. This mixed activity among gurus suggests a level of confidence in the company’s prospects, although it is tempered by the insider selling of $7.3 million worth of shares over the last three months with no buying activity. This pattern of insider selling may signal potential concerns regarding the company’s near-term performance, adding to the caution for prospective investors.
What This Means for Investors
Based on the analysis above, Apollo Global Management Inc is currently considered overvalued according to the GF Value™ assessment. The significant gap between the current stock price and its estimated fair value indicates potential risks for investors. Given the mixed signals from insider activity and the valuation metrics, caution is warranted. For further insights on Apollo Global Management Inc APO, you can visit the stock page, and explore the GF Value™ page for deeper analysis.
Frequently Asked Questions
What is APO's GF Score™?
APO has a GF Score™ of 75/100, indicating above average performance relative to its peers.
Is APO overvalued or undervalued?
APO is currently overvalued, with a GF Value™ estimate of $138.08 compared to its current price of $143.58.
What is APO's P/E ratio?
APO's P/E (TTM) ratio is 52.6x, significantly above its 5-year median of 17.3x, indicating a higher valuation compared to its historical averages.
This stock alert was generated using automated technology and GuruFocus financial data to provide readers with timely and accurate market reporting. This content was reviewed by GuruFocus editorial team prior to publication. Please send any questions or comments about this story to [email protected].

