


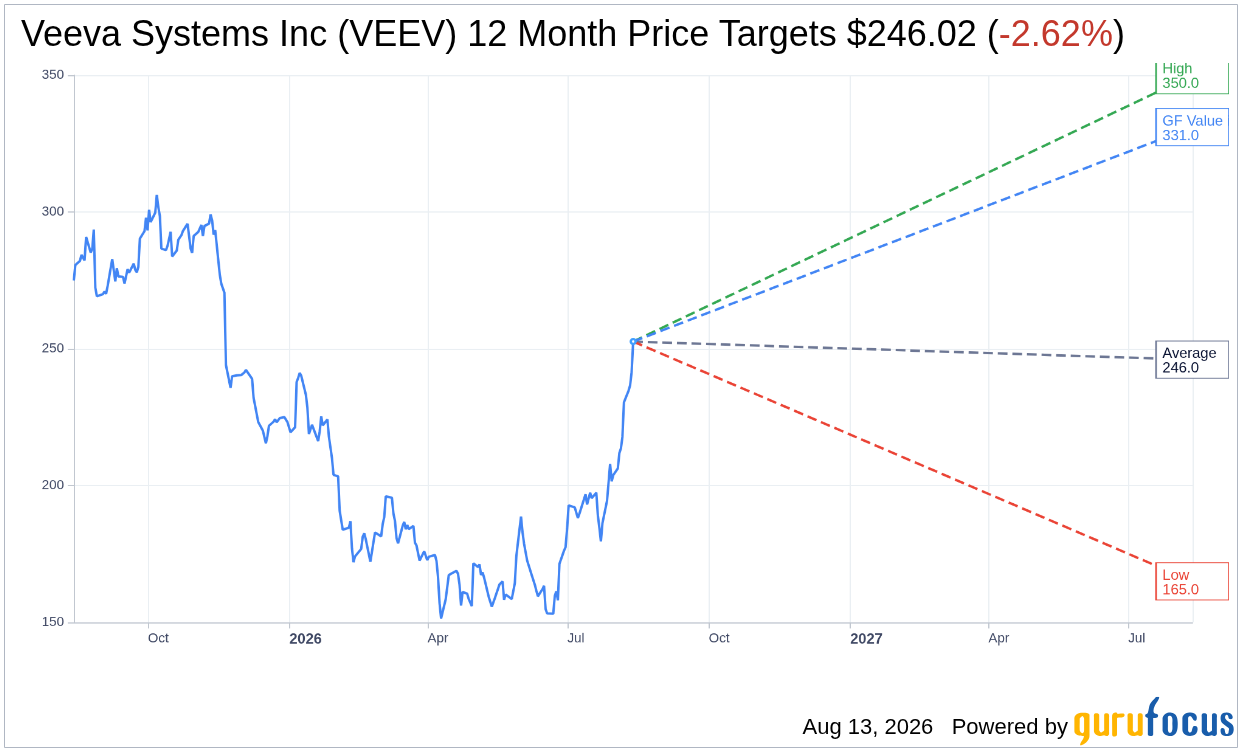
On August 13, 2026, Veeva Systems Inc VEEV shares rose 4.6% to a current price of $252.64. This increase comes amid a 52-week range of $148.05 to $310.50, indicating significant volatility over the past year.
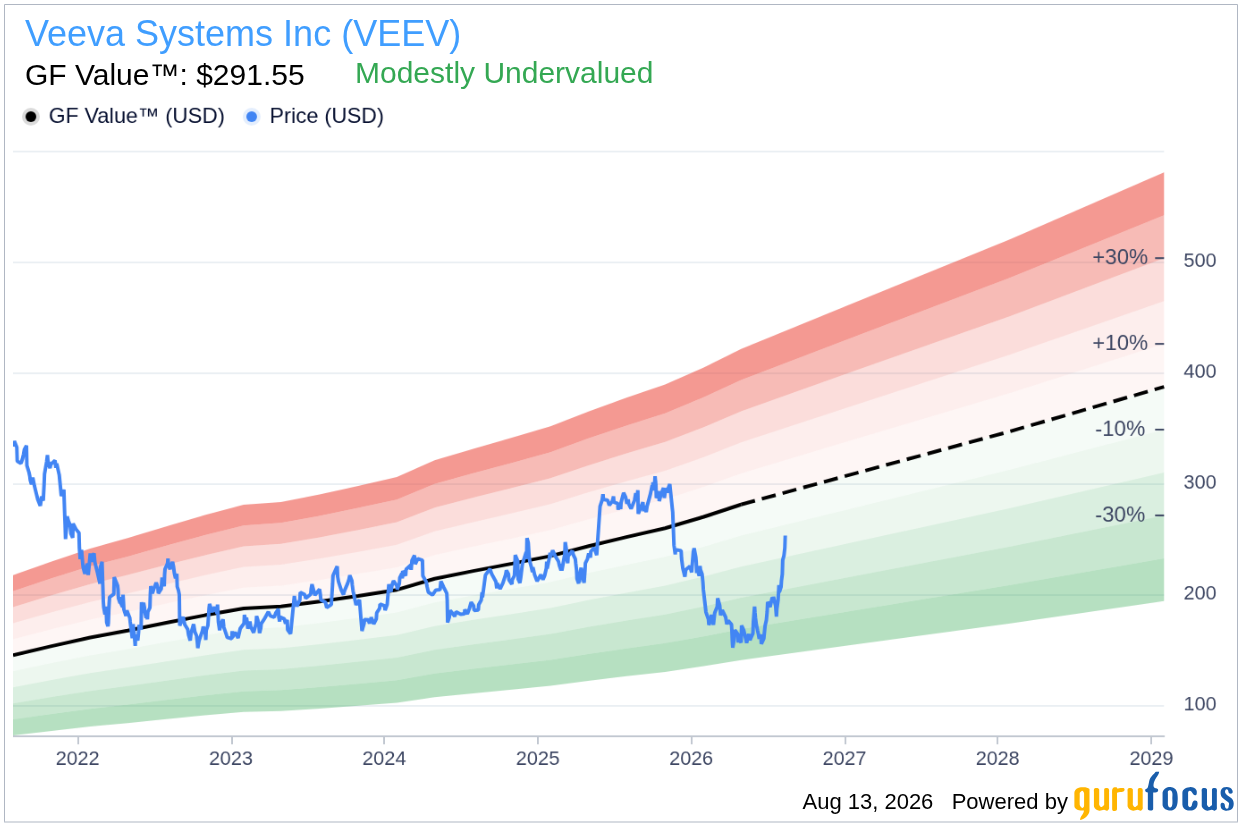
- GF Value™ verdict: VEEV is currently trading at $252.64, which is 13.3% below the GF Value™ estimate of $291.55.
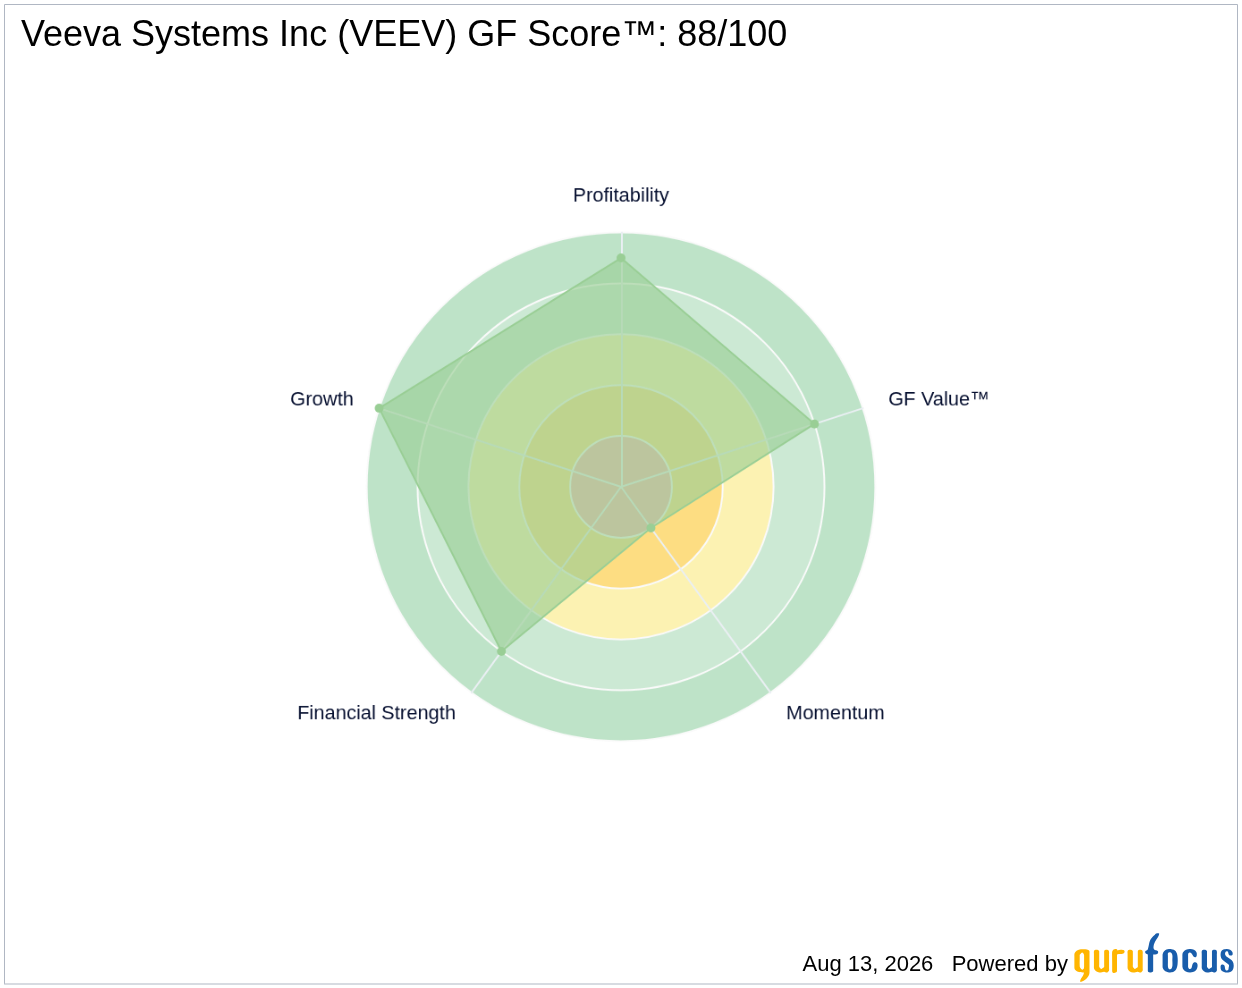
- GF Score™: VEEV has a strong score of 88/100, indicating solid fundamentals.
- Most notable signal: Insider activity shows that insiders sold $1.0 million worth of stock in the last three months, with no purchases.
Is VEEV Overvalued or Undervalued?
Veeva Systems Inc VEEV is currently trading below its GF Value™ estimate, which is $291.55, indicating that the stock is undervalued by approximately 13.3%. This presents a potential opportunity for investors looking for stocks with a margin of safety. The GF Value™ is GuruFocus' proprietary intrinsic-value estimate, derived from a combination of historical trading multiples, past business growth, and forward-looking performance estimates.
The GF Valuation label categorizes VEEV as "Modestly Undervalued," suggesting that while there is some upside potential, caution should be exercised. The stock's undervalued status could be appealing, but investors must consider the broader market context and other factors influencing Veeva's performance.
How Does VEEV's Valuation Compare to Its History?
| Metric | Current | Historical |
|---|---|---|
| P/E (TTM) | 45.0x | 59.3x |
| Forward P/E | 27.9x | N/A |
Comparing VEEV's current P/E (TTM) of 45.0x to its 5-year median P/E of 59.3x reveals that the stock is trading significantly below its historical valuation. This supports the GF Value™ verdict of being undervalued, as the current P/E is 24% below its 5-year median. The forward P/E of 27.9x also suggests that expectations for future earnings are more optimistic, potentially indicating a rebound in the stock's value.
What Does VEEV's GF Score™ Tell Us?
The GF Score™ measures a company's financial performance and quality by analyzing various factors including financial strength, profitability, growth, valuation, and momentum. With a score of 88/100, VEEV demonstrates strong fundamentals, particularly in growth and profitability, which are ranked 10/10 and 9/10 respectively. However, the momentum rank is notably weaker at 2/10, suggesting that the stock may not be experiencing strong price momentum at this time.
| Metric | Rating |
|---|---|
| GF Score™ | 88 |
| Financial Strength | 8/10 |
| Profitability | 9/10 |
| Growth | 10/10 |
| Valuation | 8/10 |
| Momentum | 2/10 |
Overall, VEEV's strong scores in growth and profitability indicate a robust business model, whereas the lower momentum rank suggests that the stock may face challenges in gaining traction in the market. This combination of strengths and weaknesses provides a nuanced view of Veeva's current position.
What Are Gurus and Insiders Doing with VEEV?
Currently, 5 gurus hold VEEV shares, with 3 increasing their positions while 8 have trimmed their holdings in recent quarters. This mixed activity signals differing opinions among institutional investors regarding the stock's future performance.
Insider activity reflects a more cautious stance, with insiders selling a total of $1.0 million worth of shares in the last three months and no purchases reported. This trend may suggest that insiders are not confident in the stock's near-term performance, or they may be capitalizing on the recent price increase.
What This Means for Investors
Given the current price of $252.64 compared to the GF Value™ estimate of $291.55, Veeva Systems Inc VEEV appears to be undervalued, presenting a potential investment opportunity. However, the mixed signals from insiders and the low momentum rank warrant caution. For further details on Veeva's financials and performance, visit the Veeva Systems Inc (VEEV) stock page and explore the GF Value™ page for more insights.
Frequently Asked Questions
What is VEEV's GF Score™?
VEEV has a GF Score™ of 88/100, indicating strong fundamentals and overall financial health.
Is VEEV overvalued or undervalued?
VEEV is currently undervalued, trading 13.3% below its GF Value™ estimate of $291.55.
What is VEEV's P/E ratio?
VEEV's P/E (TTM) is 45.0x, which is significantly lower than its 5-year median P/E of 59.3x, suggesting that the stock is trading at a discount relative to its historical valuation.
This stock alert was generated using automated technology and GuruFocus financial data to provide readers with timely and accurate market reporting. This content was reviewed by GuruFocus editorial team prior to publication. Please send any questions or comments about this story to [email protected].

