


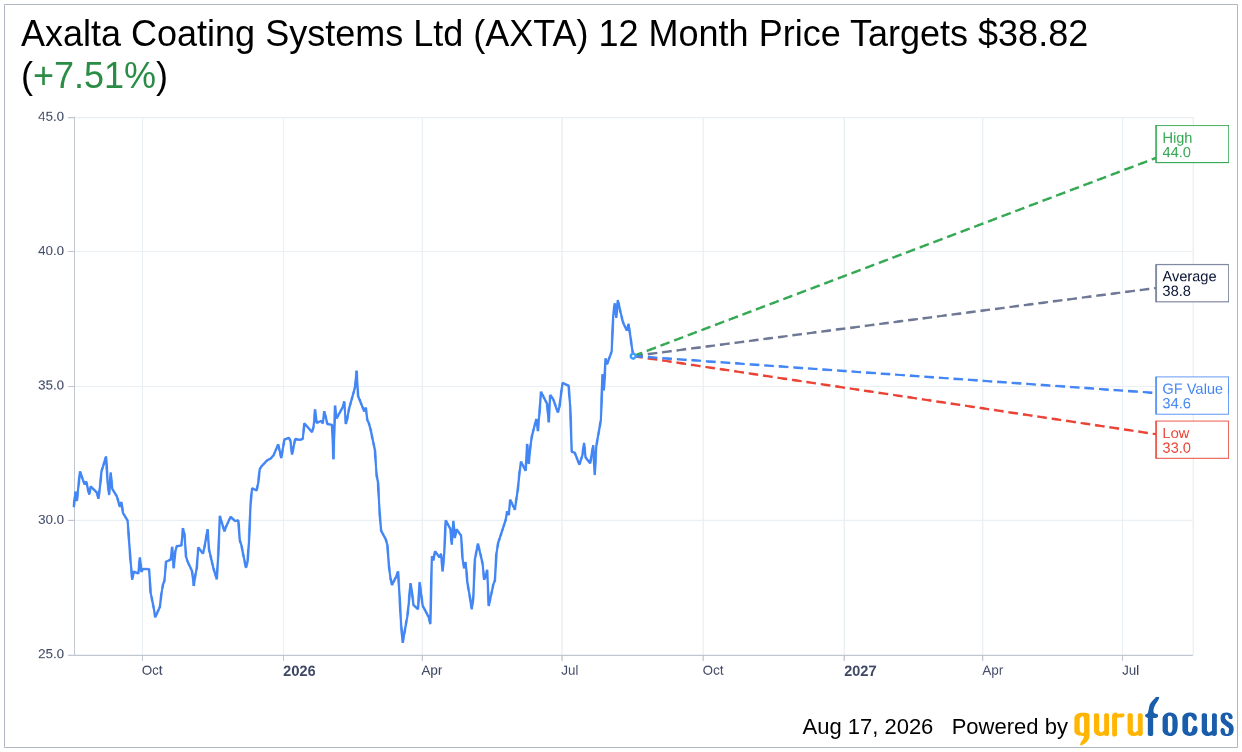
On August 17, 2026, Axalta Coating Systems Ltd AXTA shares fell 3.2% to a current price of $36.11. This decline comes amid a 52-week range that has seen the stock fluctuate between $24.94 and $38.61.
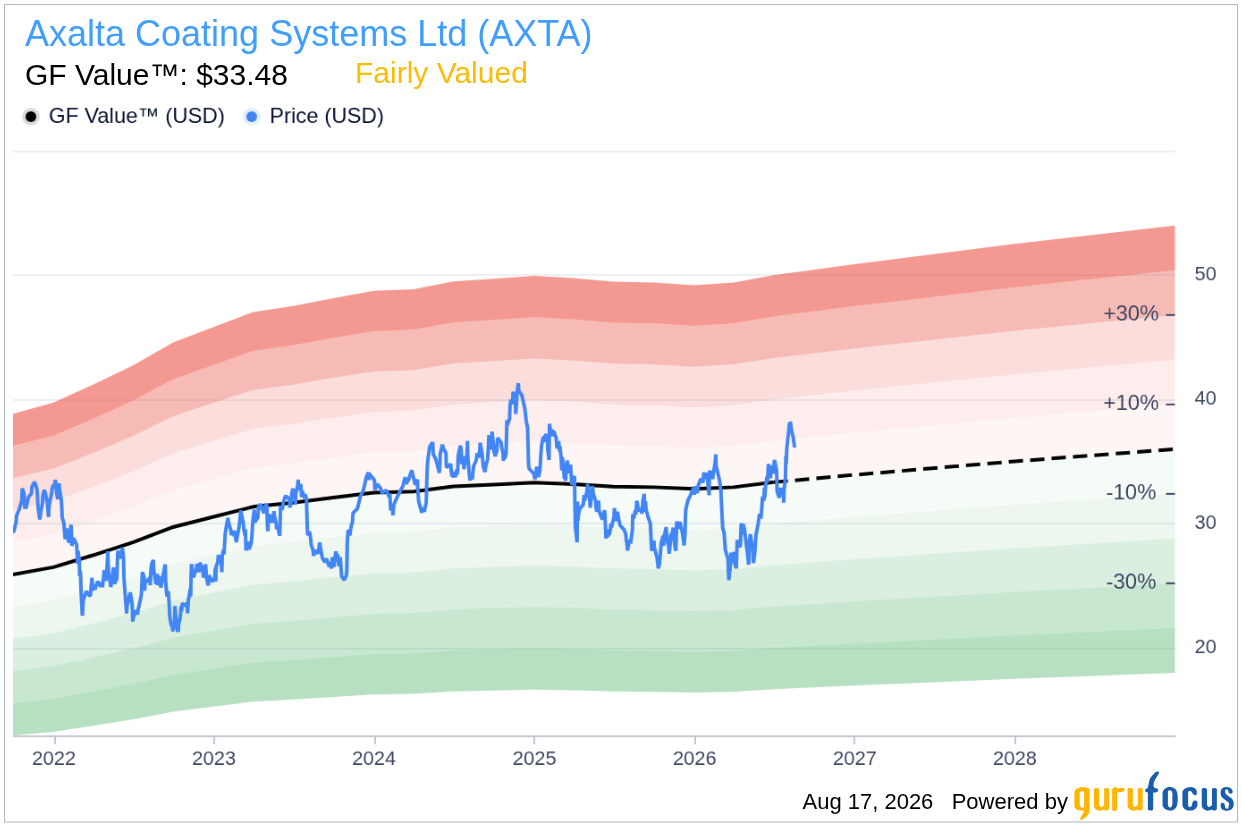
- GF Value™ verdict: Current price is $36.11, which is 7.9% above the GF Value™ of $33.48.
- GF Score™ of 79/100 indicates the stock is in the above-average category for overall performance.
- Insiders sold $0.1 million worth of stock over the past 12 months, signaling a lack of confidence from those within the company.
Is AXTA Overvalued or Undervalued?
According to the GF Value™, Axalta Coating Systems Ltd is currently overvalued, with a price of $36.11 representing a 7.9% premium over its estimated fair value of $33.48. This valuation suggests a lack of margin of safety for new investors, as the current price exceeds the intrinsic value derived from historical trading multiples, past business growth, and future performance estimates. The GF Valuation label indicates that the stock is fairly valued, but the current market price raises concerns about potential risks for investors.
The overvaluation status reflects a cautionary stance for those considering entering the stock at its current price. Should market conditions shift or company performance decline, the stock could face downward pressure, potentially leading to a correction closer to its GF Value™ estimate.
How Does AXTA's Valuation Compare to Its History?
| Metric | Current | Historical |
|---|---|---|
| P/E (TTM) | 22.3x | 25.6x |
| Forward P/E | 13.6x | N/A |
Axalta's current P/E ratio of 22.3x is notably lower than its 5-year median of 25.6x, indicating that the stock is trading below its historical valuation levels. However, the forward P/E ratio of 13.6x suggests a more favorable outlook for future earnings. This P/E analysis aligns with the GF Value™ verdict, emphasizing that while the stock may be experiencing short-term overvaluation, it could still offer long-term growth potential.
What Does AXTA's GF Score™ Tell Us?
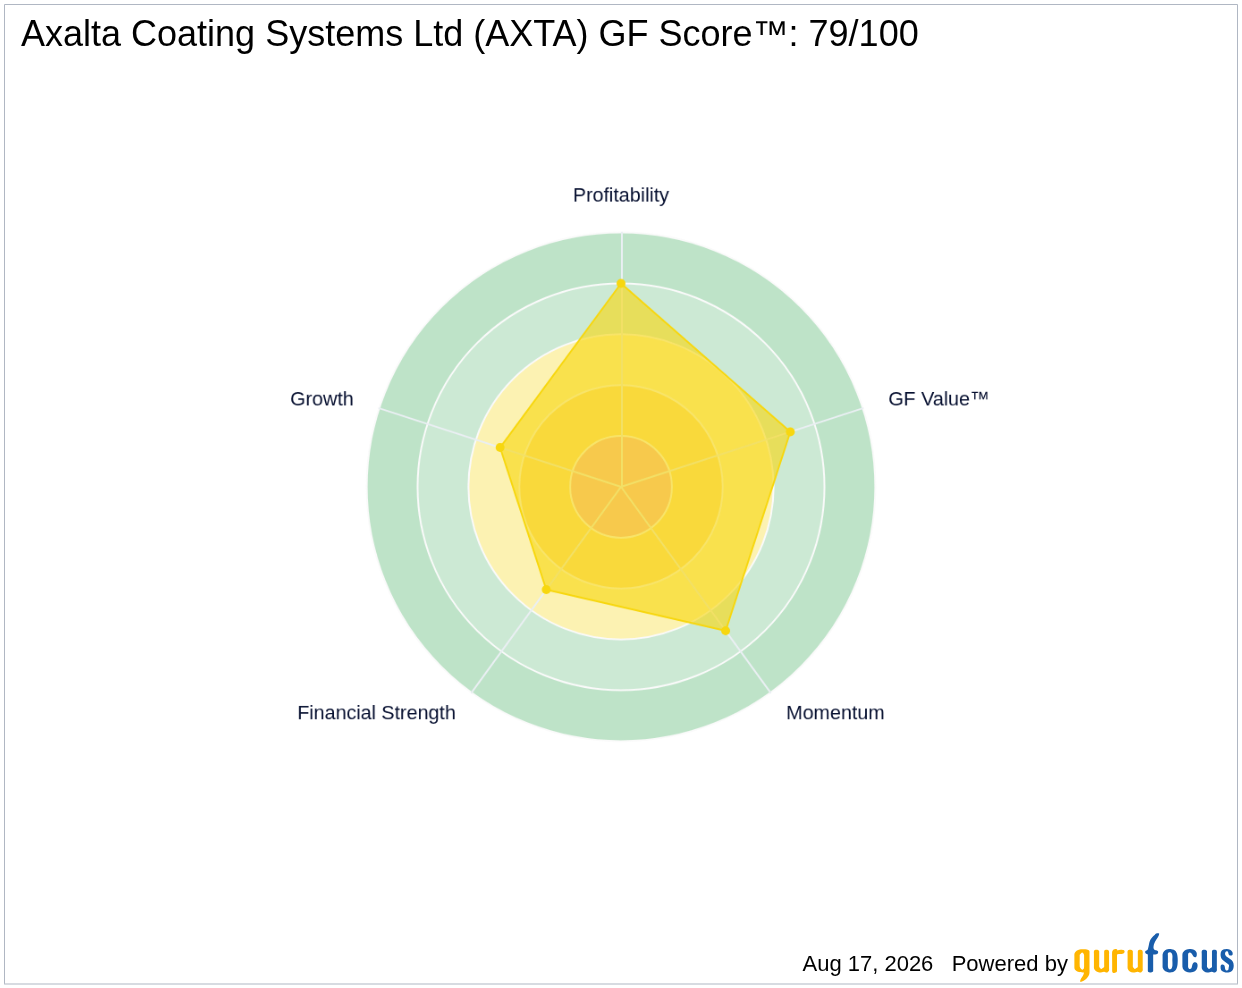
The GF Score™ measures a stock's overall performance based on various factors, including financial strength, profitability, growth, valuation, and momentum. Axalta's GF Score™ of 79/100 reflects a solid performance, with its strongest sub-rank being profitability, rated at 8/10, while growth is rated at a more modest 5/10.
| Metric | Rating |
|---|---|
| GF Score™ | 79 |
| Financial Strength | 5/10 |
| Profitability | 8/10 |
| Growth | 5/10 |
| Valuation | 7/10 |
| Momentum | 7/10 |
In summary, Axalta's strong profitability rank suggests that the company is effectively managing its profit margins and generating solid returns. However, the average ratings for financial strength and growth indicate potential areas of concern that could impact future performance. Overall, the combination of strong profitability and moderate performance in other areas reflects a balanced but cautious approach for investors.
What Are Gurus and Insiders Doing with AXTA?
As of now, 10 gurus hold positions in Axalta, with an even split of 5 adding to their holdings and 5 trimming their positions in recent quarters. This mixed activity indicates a divided sentiment among institutional investors regarding the stock's future prospects.
On the insider front, the sale of $0.1 million worth of shares over the past 12 months raises some concerns about management's confidence in the company's outlook. The absence of insider buying during this period suggests that insiders may not see immediate value in acquiring more shares at current levels. This combination of guru activity and insider selling may warrant caution for prospective buyers.
What This Means for Investors
In conclusion, Axalta Coating Systems Ltd appears to be overvalued based on the GF Value™ estimate, indicating potential risks for new investors at the current price of $36.11. The stock's GF Score™ of 79/100 reflects a generally solid performance, although there are areas of concern, particularly in terms of financial strength and insider sentiment. Investors may want to monitor the stock closely as market conditions evolve.
For further details, you can visit the Axalta Coating Systems Ltd AXTA stock page, or explore the GF Value™ page for more insights.
Frequently Asked Questions
What is AXTA's GF Score™?
AXTA has a GF Score™ of 79/100, indicating above-average overall performance compared to its peers.
Is AXTA overvalued or undervalued?
AXTA is currently overvalued, with a GF Value™ estimate of $33.48 compared to the current price of $36.11.
What is AXTA's P/E ratio?
AXTA's P/E ratio is 22.3x, which is below its 5-year median of 25.6x, suggesting the stock is trading favorably compared to its historical valuation.
This stock alert was generated using automated technology and GuruFocus financial data to provide readers with timely and accurate market reporting. This content was reviewed by GuruFocus editorial team prior to publication. Please send any questions or comments about this story to [email protected].

