


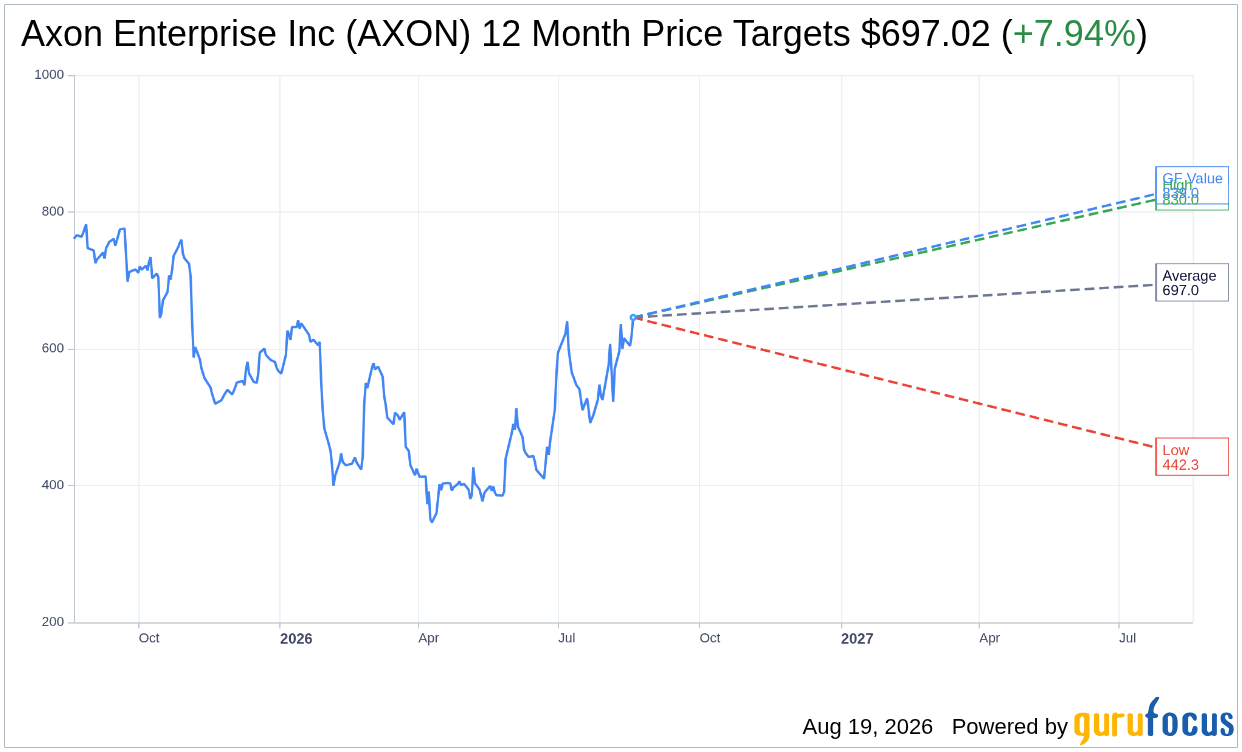
On August 19, 2026, Axon Enterprise Inc AXON shares rose 4.2% to a current price of $645.72. The stock has shown considerable momentum recently, with a 52-week trading range between $339.01 and $794.29.
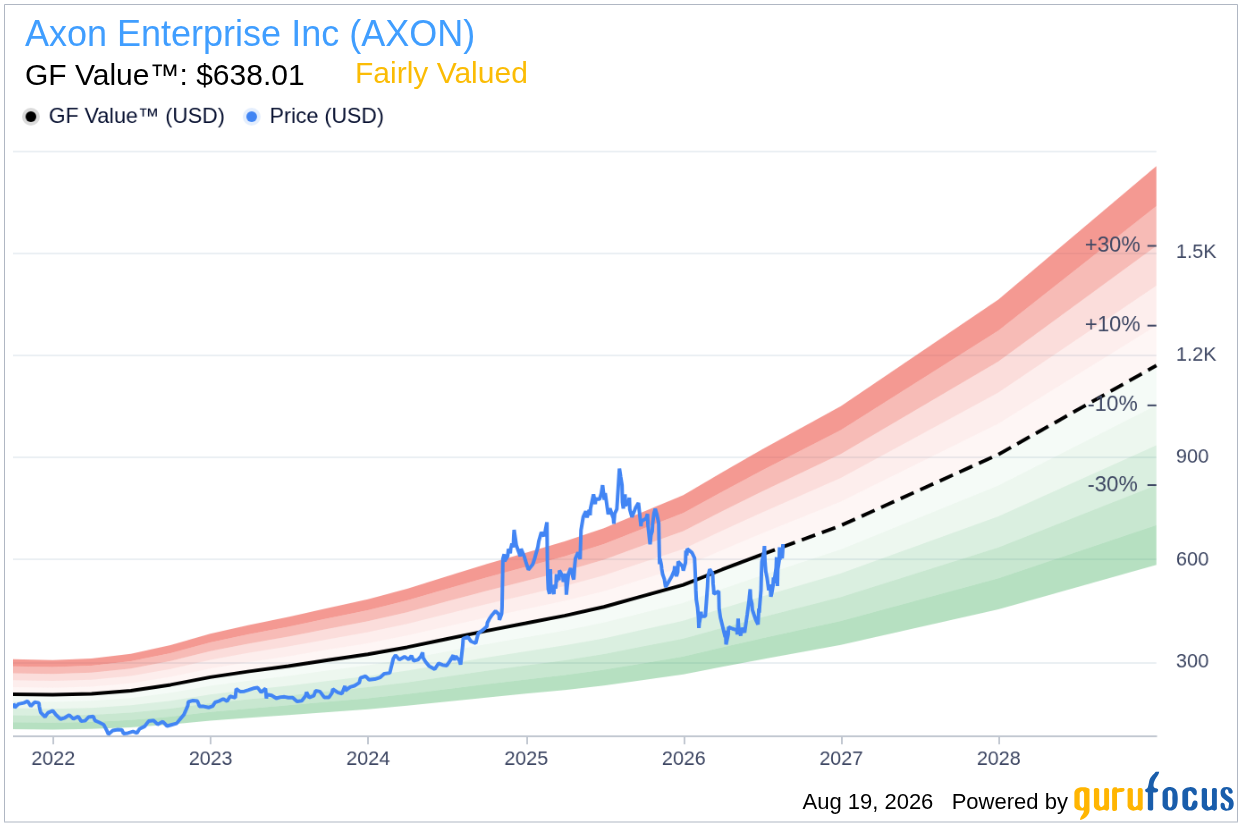
- GF Value™ verdict: The current price is $645.72, which is 1.2% above the GF Value™ estimate of $638.01, indicating that the stock is overvalued.
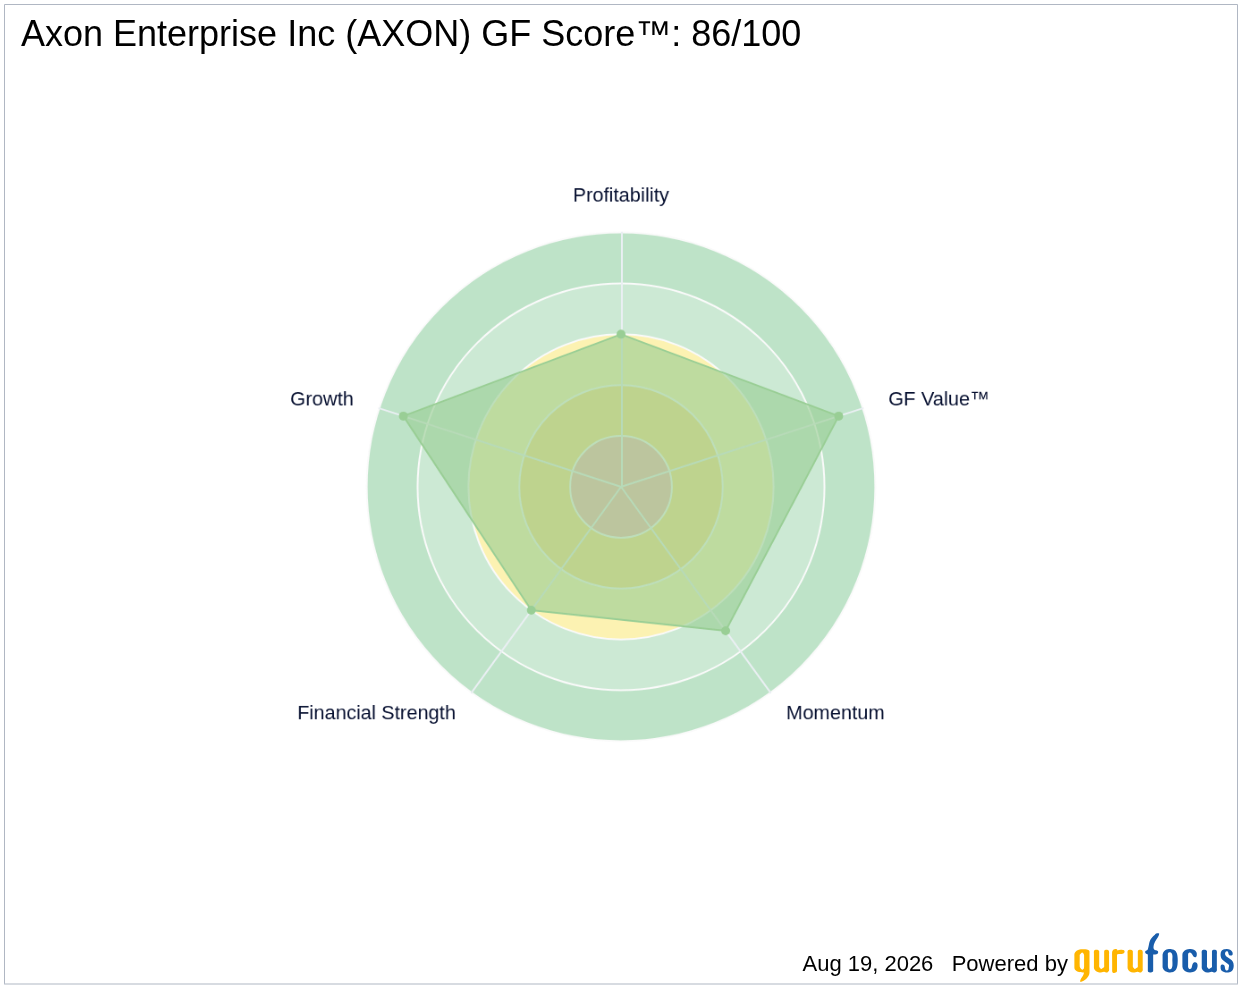
- GF Score™: The stock has a score of 86/100, suggesting a strong overall performance across various metrics.
- Insider activity: Insiders sold $127.3M worth of shares over the past 12 months, with no buying activity reported.
Is AXON Overvalued or Undervalued?
Axon Enterprise Inc AXON currently trades at $645.72, slightly above its GF Value™ estimate of $638.01, translating to a 1.2% overvaluation. The GF Value™ is GuruFocus' proprietary intrinsic value measure, calculated based on historical trading multiples, past growth rates, and future performance forecasts. The slight premium above the GF Value™ suggests that while the stock has been performing well, it may not present a compelling margin of safety for new investors at this time.
Being overvalued poses risks, particularly in a market environment where valuations can quickly shift due to macroeconomic factors or changes in investor sentiment. The GF Valuation label indicates that while the stock is fairly valued, the current price suggests a cautious approach may be warranted.
How Does AXON's Valuation Compare to Its History?
| Metric | Current | Historical |
|---|---|---|
| P/E (TTM) | 267.9x | 131.4x |
| Forward P/E | 84.2x | N/A |
Axon's current P/E ratio of 267.9x is significantly higher than its 5-year median P/E of 131.4x, indicating that the stock is trading at a much higher valuation compared to its historical averages. This analysis corroborates the GF Value™ verdict, suggesting that AXON is indeed overvalued based on its historical performance metrics.
What Does AXON's GF Score™ Tell Us?
The GF Score™ evaluates a company's performance across several factors, including financial strength, profitability, growth, valuation, and momentum. Axon received a strong GF Score™ of 86/100, with notable strengths in growth (9/10) and valuation (9/10), while showing weaknesses in financial strength (6/10) and profitability (6/10).
| Metric | Rating |
|---|---|
| GF Score™ | 86 |
| Financial Strength | 6/10 |
| Profitability | 6/10 |
| Growth | 9/10 |
| Valuation | 9/10 |
| Momentum | 7/10 |
The strong GF Score™ indicates that while Axon has solid growth potential and relatively favorable valuation metrics, its financial strength and profitability could be areas of concern. Investors may want to consider these factors when evaluating the stock's long-term prospects.
What Are Gurus and Insiders Doing with AXON?
Currently, nine gurus hold shares of Axon Enterprise Inc, with seven adding to their positions and two trimming their holdings in recent quarters. This positive guru activity reflects a generally favorable outlook among knowledgeable investors.
However, the insider selling of $127.3M worth of shares over the past 12 months, with no buying activity, raises questions about management's confidence in the stock's future performance. Such a pattern may imply that insiders anticipate challenges ahead or believe that the stock is currently overvalued, reinforcing the cautious stance suggested earlier.
What This Means for Investors
The valuation assessment of Axon Enterprise Inc AXON indicates that the stock is currently overvalued based on the GF Value™ estimate. While its strong GF Score™ and positive guru activity provide some reassurance, the high P/E ratio compared to historical averages and significant insider selling suggest a degree of caution for potential investors. For further insights and a comprehensive analysis, you can visit the Axon Enterprise Inc (AXON) stock page.
Frequently Asked Questions
What is AXON's GF Score™?
Axon has a GF Score™ of 86/100, indicating strong performance across various metrics.
Is AXON overvalued or undervalued?
AXON is currently overvalued, trading at 1.2% above its GF Value™ estimate.
What is AXON's P/E ratio?
AXON's P/E ratio is 267.9x, significantly higher than its 5-year median of 131.4x, indicating a premium valuation.
This stock alert was generated using automated technology and GuruFocus financial data to provide readers with timely and accurate market reporting. This content was reviewed by GuruFocus editorial team prior to publication. Please send any questions or comments about this story to [email protected].

