


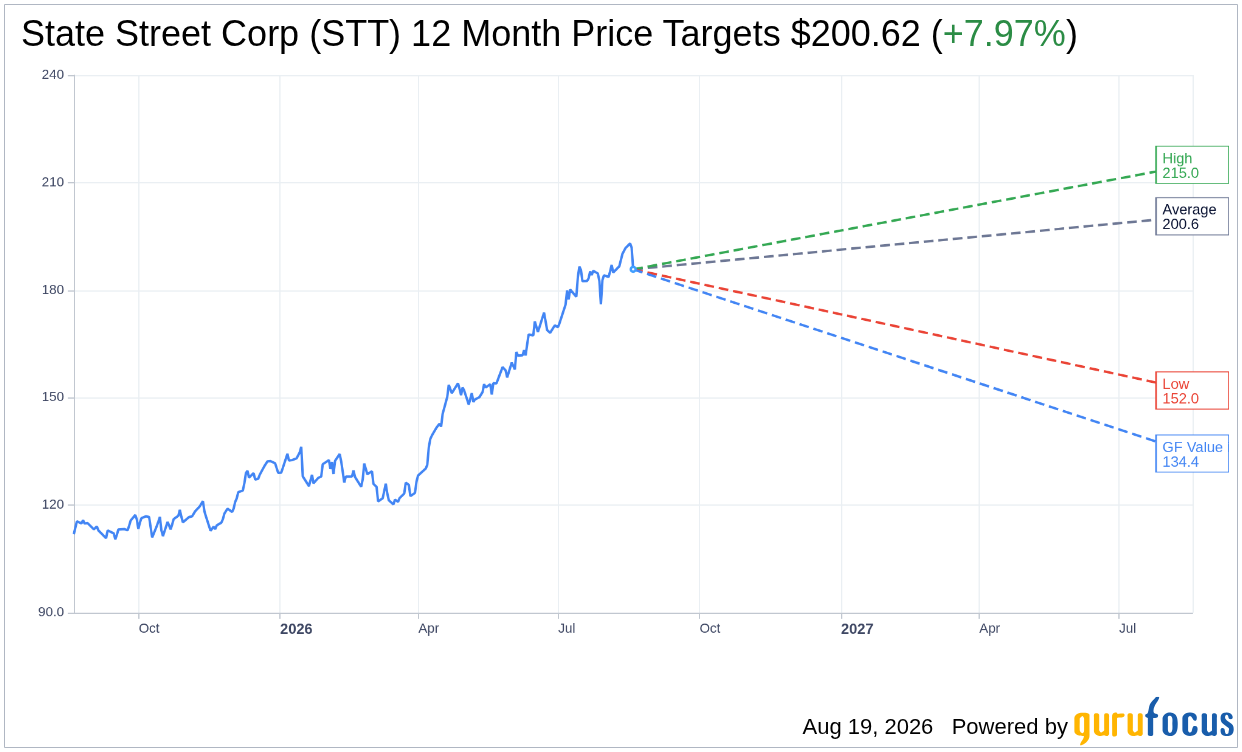
On August 19, 2026, State Street Corp STT shares fell 3.2%, closing at $185.81. This decline comes as the stock has seen a 52-week high of $195.18 and a low of $104.64.
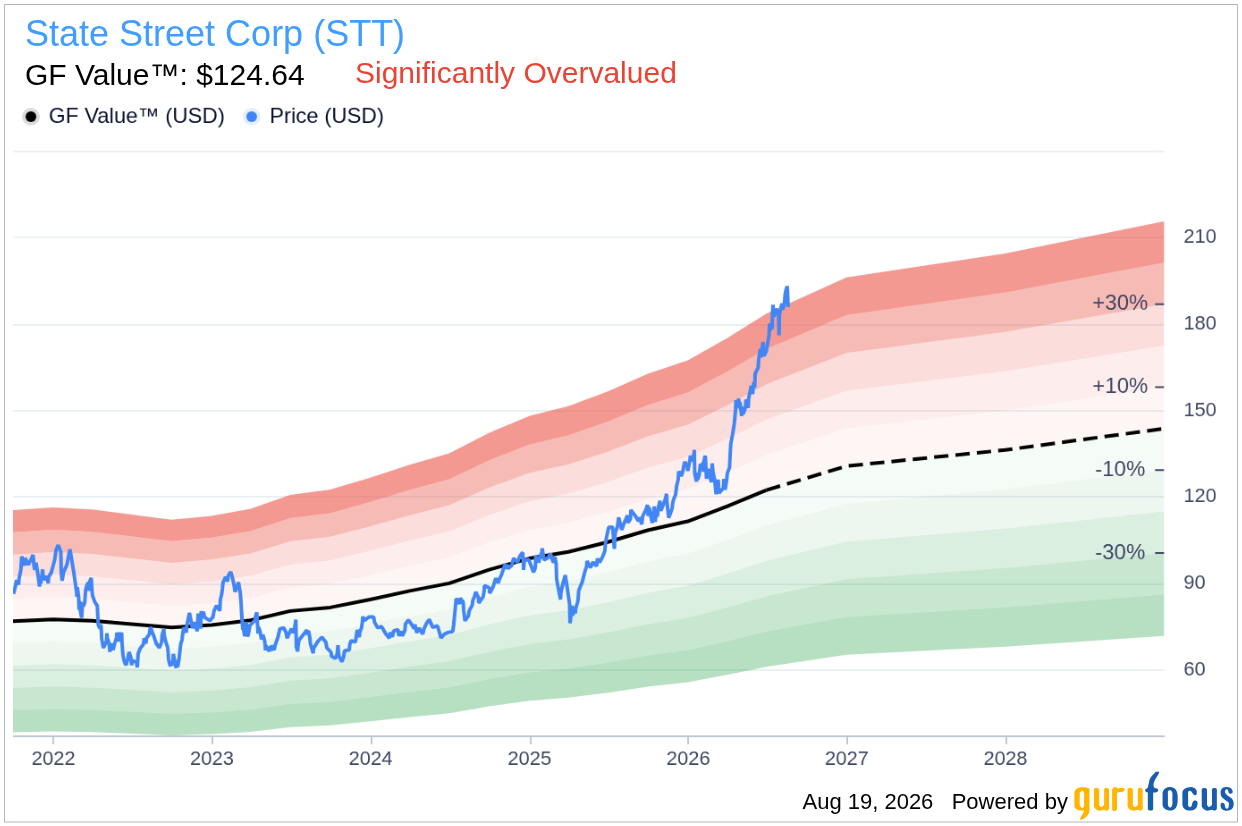
- GF Value™ verdict: STT is currently trading at $185.81, which is 49.1% above its GF Value™ estimate of $124.64, indicating the stock is significantly overvalued.
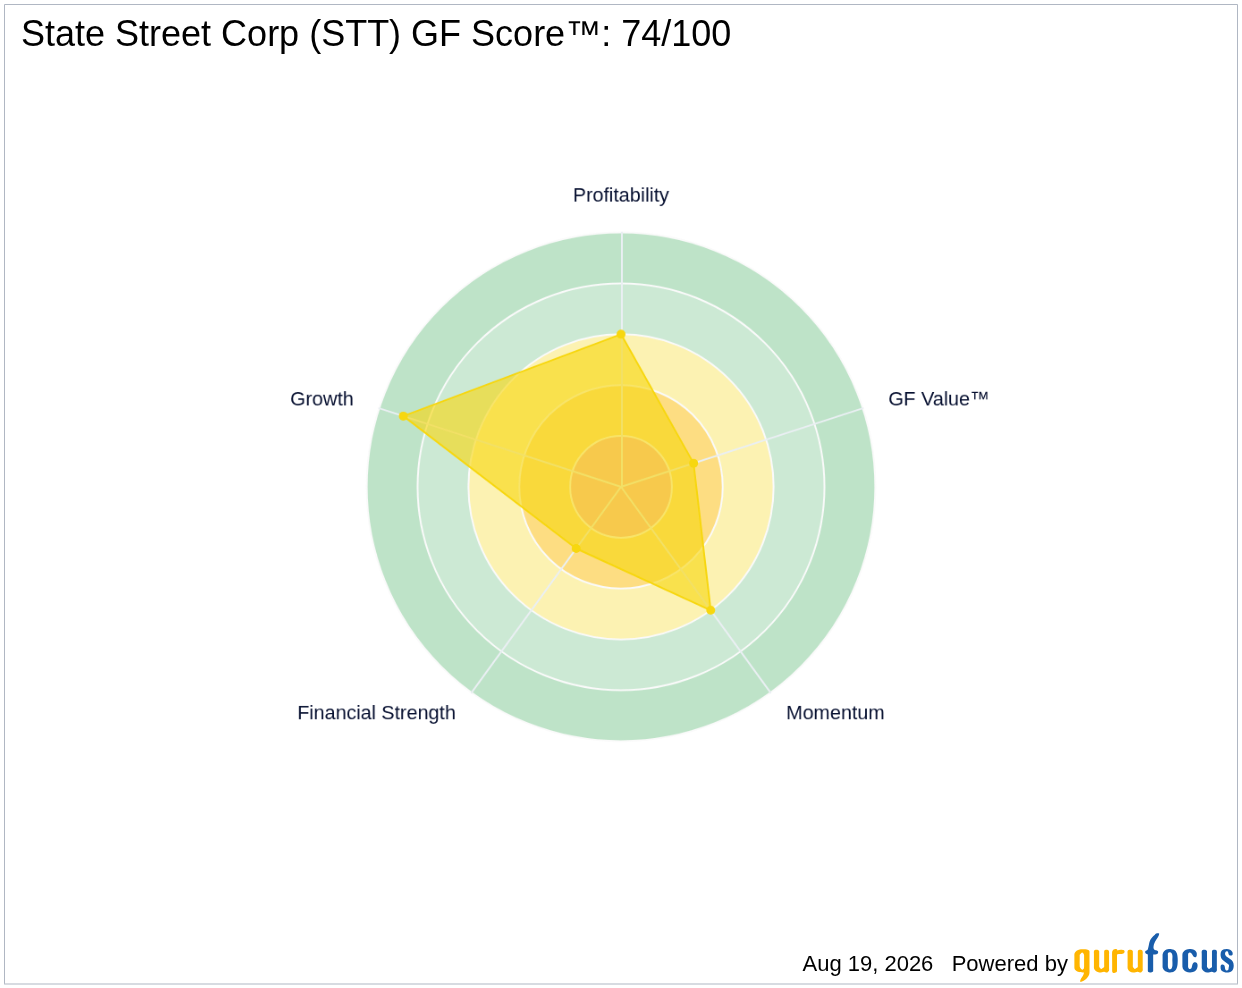
- GF Score™ of 74/100 signifies that the company is performing above average compared to its peers.
- Insider activity reflects a negative sentiment, with insiders selling $22.6 million more than they bought over the past 12 months.
Is STT Overvalued or Undervalued?
According to GuruFocus, GF Value™ represents an intrinsic value estimate based on historical trading multiples, past business growth, and future performance expectations. Currently, State Street's stock price of $185.81 is significantly above the GF Value™ estimate of $124.64, implying a considerable margin of safety for potential investors. This valuation is labeled as significantly overvalued, which raises concerns about the sustainability of the stock's current price levels.
The 49.1% premium to GF Value™ suggests that investors may be overestimating the company’s future growth prospects, or it may indicate an overreaction to recent market trends. There is a risk associated with investing in a stock that is trading at such a significant premium to its intrinsic value, as market corrections could lead to sharp declines in the stock price if expectations are not met.
How Does STT's Valuation Compare to Its History?
| Metric | Current | Historical |
|---|---|---|
| P/E (TTM) | 16.4x | 12.5x |
| Forward P/E | 13.6x | N/A |
The current P/E ratio of 16.4x is 31% above its 5-year median of 12.5x, indicating that the stock is trading at a premium compared to its historical valuation. This P/E analysis is consistent with the GF Value™ verdict, further supporting the conclusion that the stock is overvalued relative to its historical performance.
What Does STT's GF Score™ Tell Us?
GF Score™ assesses various aspects of a company’s financial health, profitability, growth potential, and valuation metrics. With a GF Score™ of 74/100, State Street is rated above average in its industry. Its strongest sub-rank is Growth at 9/10, indicating solid prospects for future earnings expansion. However, the Valuation Rank is notably low at 3/10, aligning with the overvaluation indicated by GF Value™.
| Metric | Rating |
|---|---|
| GF Score™ | 74 |
| Financial Strength | 3/10 |
| Profitability | 6/10 |
| Growth | 9/10 |
| Valuation | 3/10 |
| Momentum | 6/10 |
The combination of scores indicates that while State Street exhibits strong growth potential, its financial strength and valuation metrics raise red flags for potential investors. This discrepancy between growth and valuation suggests caution in light of the current price levels.
What Are Gurus and Insiders Doing with STT?
Currently, 16 gurus hold positions in State Street Corp, with 3 adding to their stakes and 12 trimming their positions in recent quarters. This mixed sentiment from institutional investors indicates a cautious approach towards STT.
Additionally, insider activity shows a significant net selling of $22.6 million over the past 12 months, with only $0.3 million in purchases. This trend suggests that insiders may not be confident in the stock's future performance, which could be a concerning indicator for prospective investors.
What This Means for Investors
Based on the analysis, State Street Corp is deemed significantly overvalued according to the GF Value™ estimate. The combination of high current valuations, poor financial strength, and negative insider activity suggests that investors may want to proceed with caution. For those interested in further details, you can explore the State Street Corp STT stock page to gain deeper insights into this investment opportunity.
Frequently Asked Questions
What is STT's GF Score™?
STT has a GF Score™ of 74/100, which indicates that it is performing above average compared to its industry peers.
Is STT overvalued or undervalued?
STT is currently overvalued, trading at $185.81 compared to its GF Value™ estimate of $124.64.
What is STT's P/E ratio?
STT's P/E ratio is 16.4x, which is significantly above its 5-year median of 12.5x, suggesting it is trading at a premium relative to its historical valuation.
This stock alert was generated using automated technology and GuruFocus financial data to provide readers with timely and accurate market reporting. This content was reviewed by GuruFocus editorial team prior to publication. Please send any questions or comments about this story to [email protected].

