


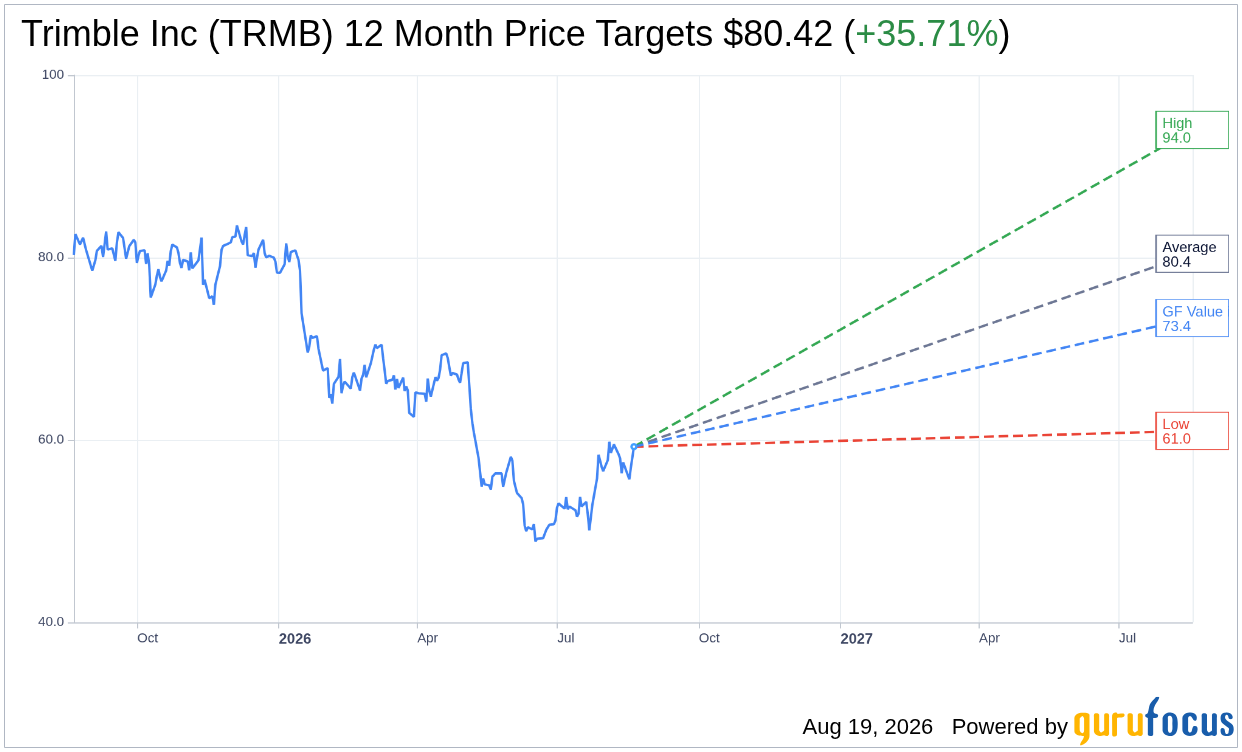
On August 19, 2026, Trimble Inc TRMB shares rose 4.0% to $59.26, reflecting a positive shift amidst a challenging year for the company. The stock has fluctuated between a 52-week high of $84.42 and a low of $47.92.
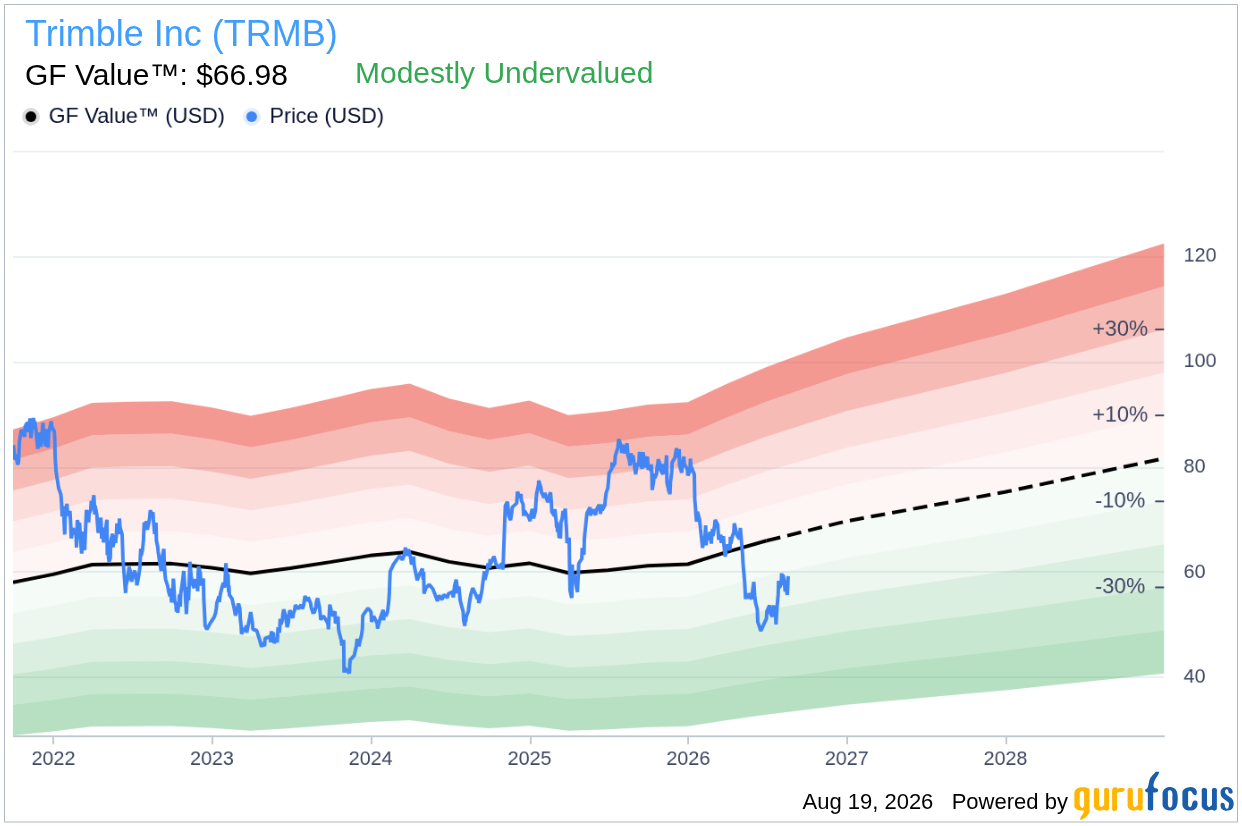
- GF Value™ verdict: Current price of $59.26 is 11.5% below GF Value™ of $66.98.
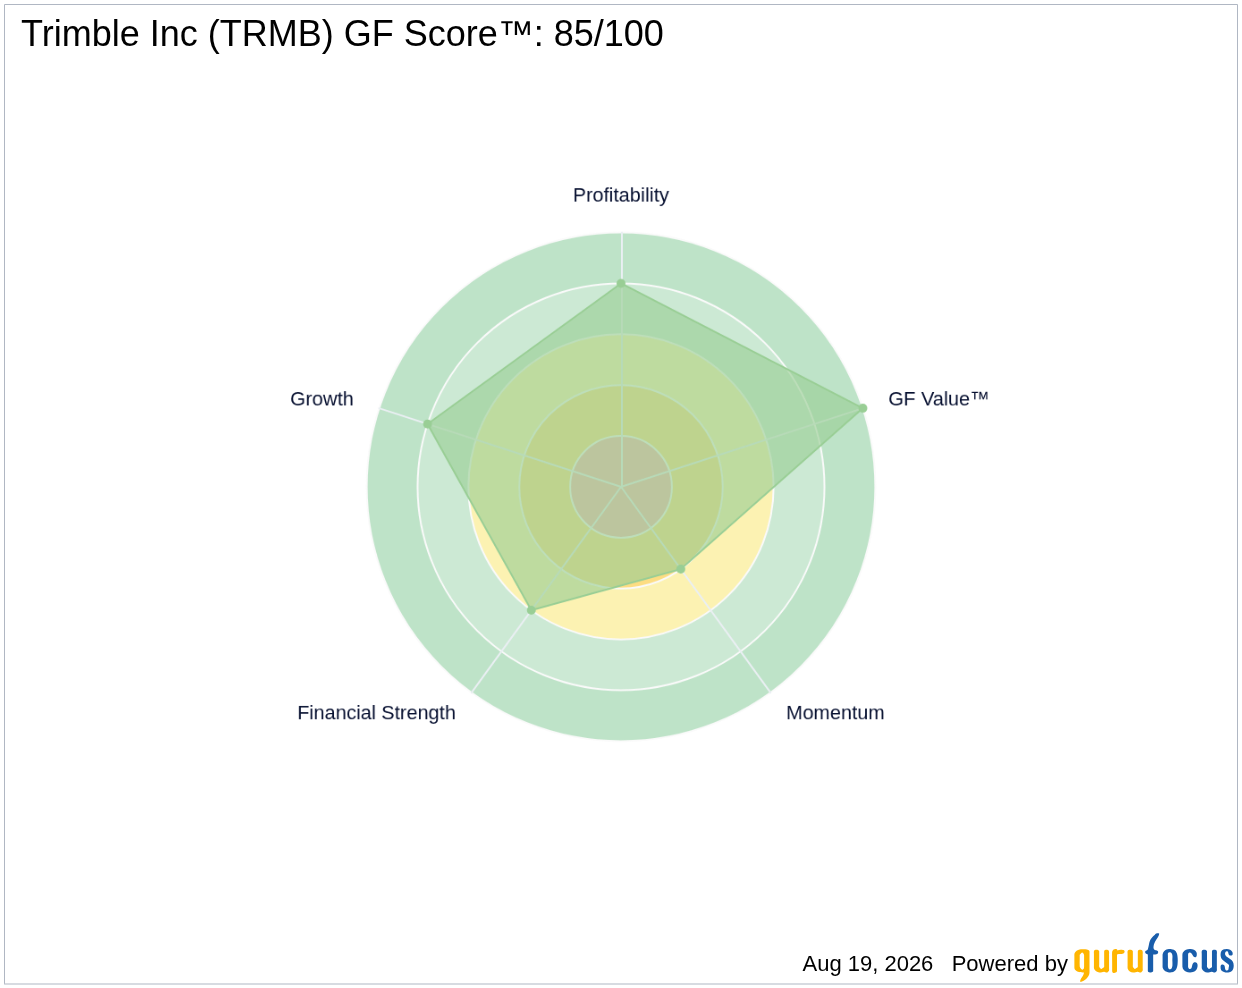
- GF Score™: 85/100, indicating a strong overall rating.
- Most notable signal: Insiders sold $7.5M worth of stock over the past 12 months, with no buying activity.
Is TRMB Overvalued or Undervalued?
Trimble Inc currently trades at $59.26, which is below the GF Value™ estimate of $66.98, suggesting that the stock is undervalued by approximately 11.5%. However, this valuation should be approached with caution. GF Value™ is GuruFocus' proprietary estimate of a stock's intrinsic value, calculated using historical trading multiples, business growth rates, and projections for future performance. Given that Trimble is currently unprofitable and cash-flow negative, relying solely on earnings-based valuations such as the price-to-earnings (P/E) ratio may not provide an accurate picture of the company's worth.
The GF Valuation label indicates that the stock is modestly undervalued, but the underlying financial health and performance metrics should be scrutinized. Investors should be aware that the GF Value™ estimate may not be as reliable for companies experiencing losses, and in this case, it serves more as a directional warning than a precise fair value target. Therefore, while the stock appears undervalued, potential investors should weigh the risks associated with its current financial status.
How Does TRMB's Valuation Compare to Its History?
| Metric | Current | Historical |
|---|---|---|
| P/E (TTM) | 16.2x | 34.4x |
Trimble's current forward P/E of 16.2x is significantly lower than its 5-year median P/E of 34.4x. This suggests that the stock is trading below its historical valuation levels, aligning with the GF Value™ indication of being undervalued. The P/E analysis supports the notion that Trimble's stock could present a buying opportunity, though investors should remain cautious given its unprofitable status.
What Does TRMB's GF Score™ Tell Us?
The GF Score™ provides a comprehensive measure of a stock's attractiveness based on various factors, including financial strength, profitability, growth potential, valuation, and momentum. Trimble's GF Score™ of 85/100 reflects a strong overall assessment, with high marks in profitability and growth ranks, while the momentum rank is notably weaker.
| Metric | Rating |
|---|---|
| GF Score™ | 85/100 |
| Financial Strength | 6/10 |
| Profitability | 8/10 |
| Growth | 8/10 |
| Valuation | 10/10 |
| Momentum | 4/10 |
Trimble exhibits strong profitability and growth prospects, which are its strongest areas according to the GF Score™. However, the financial strength score of 6/10 indicates some concerns regarding the company's stability, and the low momentum rank of 4/10 suggests a lack of positive price trends in the near term. Together, these scores paint a nuanced picture of Trimble's potential moving forward.
What Are Gurus and Insiders Doing with TRMB?
Currently, 8 gurus hold shares of Trimble Inc, with 6 increasing their positions and 2 reducing them in recent quarters. This activity indicates a generally positive sentiment among institutional investors, as many are willing to add to their stakes in the company. However, the insider activity presents a contrasting picture, with insiders selling $7.5M worth of shares over the past 12 months and no buying activity reported. This selling could signal a lack of confidence from those closest to the company, which may warrant further investigation by potential investors.
What This Means for Investors
Based on the GF Value™ estimate and the current stock price, Trimble Inc appears to be undervalued at $59.26. However, it is essential to recognize the company's unprofitability and the mixed signals from insider trading activity. Therefore, while there may be opportunities in the stock, potential investors should approach with caution and fully assess the company's financial health and future prospects.
For more detailed information, visit the Trimble Inc TRMB stock page for a comprehensive analysis of its performance and metrics.
Frequently Asked Questions
What is TRMB's GF Score™?
Trimble Inc has a GF Score™ of 85/100, indicating a strong overall evaluation based on various financial metrics.
Is TRMB overvalued or undervalued?
The stock is currently undervalued, with a GF Value™ estimate of $66.98, suggesting a potential upside from its current price.
What is TRMB's P/E ratio?
Trimble's forward P/E ratio is 16.2x, significantly lower than its 5-year median P/E of 34.4x, indicating it is trading below its historical valuation levels.
This stock alert was generated using automated technology and GuruFocus financial data to provide readers with timely and accurate market reporting. This content was reviewed by GuruFocus editorial team prior to publication. Please send any questions or comments about this story to [email protected].

