


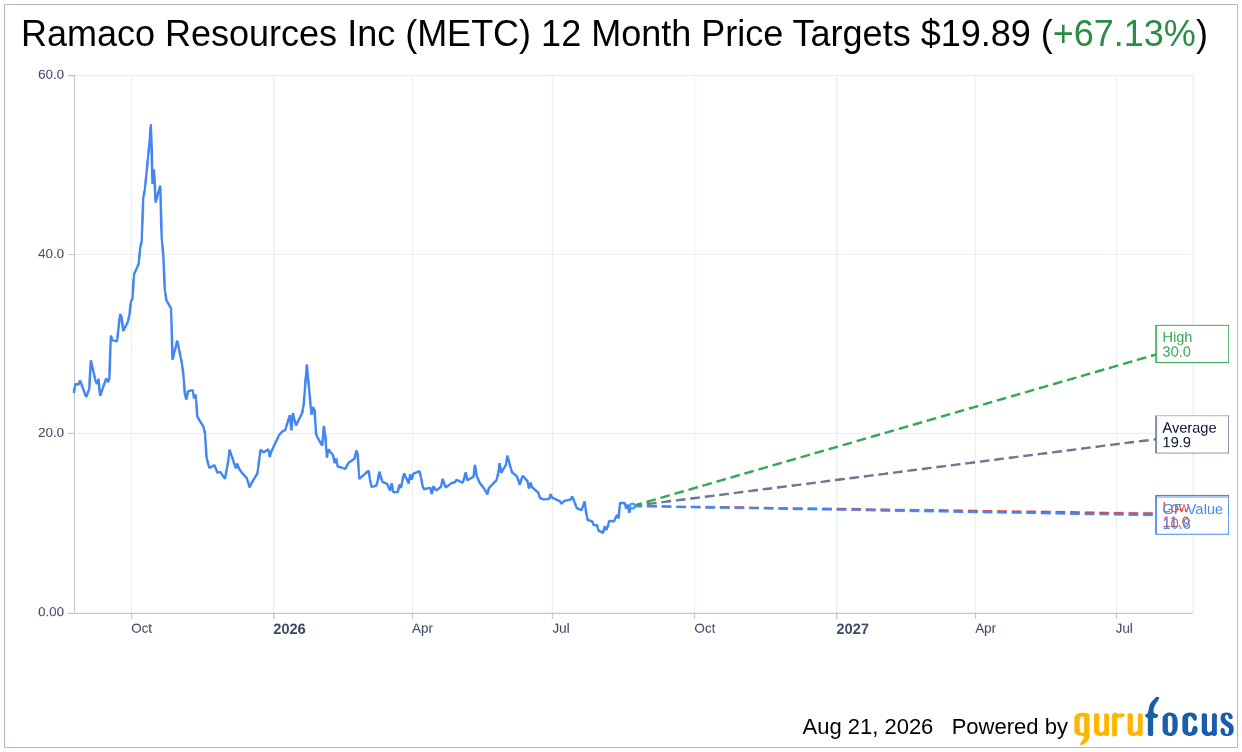
On August 21, 2026, Ramaco Resources Inc METC shares experienced a notable rise of 6.8%, bringing the current price to $11.90. This price movement comes amid a challenging year for the company, with shares down 33.9% year-to-date and a staggering 45.6% decline over the past year. The stock has traded within a 52-week range of $8.56 to $57.80.
- GF Value™ verdict: Current price of $11.90 vs GF Value of $8.88, indicating a 34.0% overvaluation.
- GF Score™ of 79/100, suggesting above-average performance relative to peers.
- Insider activity reveals significant selling, with insiders offloading $66.1M worth of shares over the past 12 months.
Is METC Overvalued or Undervalued?
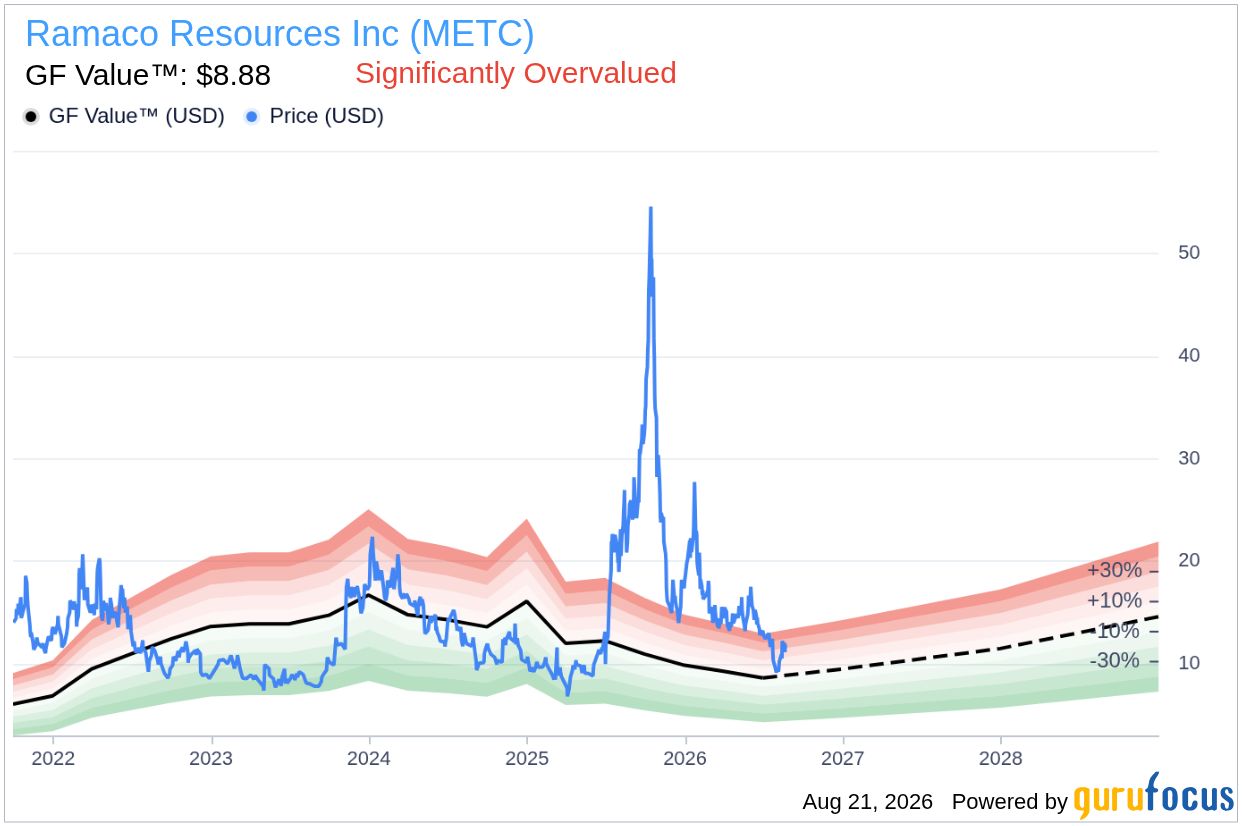
Currently, Ramaco Resources Inc METC is trading at $11.90, while the GF Value™, which estimates the intrinsic value of the stock based on historical trading multiples, past business growth, and future performance forecasts, is pegged at $8.88. This suggests that the stock is approximately 34.0% overvalued. The GF Valuation label classifies METC as significantly overvalued, indicating that the current market price does not have a sufficient margin of safety for potential investors. Such a high overvaluation presents notable risks for investors, particularly in a volatile market.
The GF Value™ serves as a directional indicator rather than a precise fair-value target, especially for a company like METC, which is currently unprofitable and cash-flow negative. This makes earnings-based valuation metrics like P/E less applicable for assessing the stock's true value.
How Does METC's Valuation Compare to Its History?
| Metric | Current | Historical |
|---|---|---|
| P/E (TTM) | N/A | 10.4x (5-Year Median) |
| Forward P/E | 1009.0x | N/A |
As METC currently does not have a trailing P/E ratio due to its unprofitable status, we cannot directly compare the current P/E to its historical median. However, the forward P/E of 1009.0x indicates that the market is pricing in extraordinarily high future earnings growth, which may not be realistic given the company's current financial struggles. This lack of a viable P/E ratio aligns with the GF Value™ verdict, reinforcing the notion that the stock is overvalued based on traditional valuation metrics.
What Does METC's GF Score™ Tell Us?
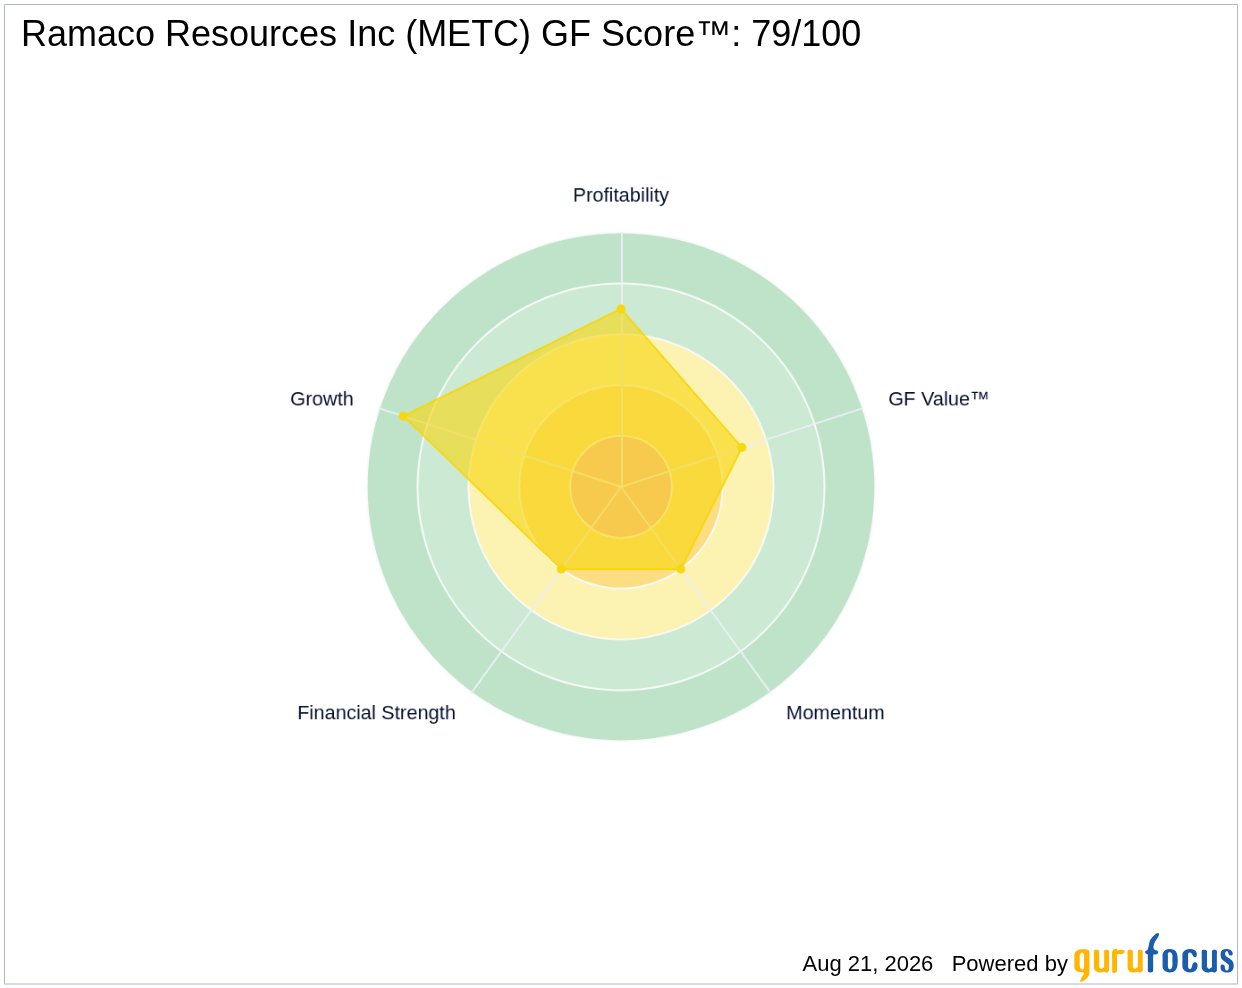
The GF Score™ is a composite score that evaluates a company's financial strength, profitability, growth potential, valuation, and momentum. METC's GF Score™ of 79/100 indicates above-average performance. The strongest sub-rank is in Growth at 9/10, while the weakest is in Financial Strength at 4/10.
| Metric | Rating |
|---|---|
| GF Score™ | 79/100 |
| Financial Strength | 4/10 |
| Profitability | 7/10 |
| Growth | 9/10 |
| Valuation | 5/10 |
| Momentum | 4/10 |
Overall, METC's scores present a mixed picture. While the company's growth potential is encouraging, the lower financial strength and momentum scores indicate vulnerabilities that could impact its future performance. This combination of strengths and weaknesses suggests that while there may be opportunities for growth, investors should be cautious about the inherent risks associated with the stock.
What Are Gurus and Insiders Doing with METC?
Currently, two gurus hold shares of METC, with one adding to their position while three have trimmed their holdings in recent quarters. This mixed signal from the guru community suggests a cautious outlook among professional investors. In addition, insider activity has shown significant selling, with insiders offloading $66.1 million worth of shares over the past 12 months without any reported buying. Such a pattern raises concerns about the company’s future prospects and may indicate a lack of confidence from those closest to the business.
This combination of guru and insider activity highlights the need for careful consideration when evaluating METC. The outflow of insider capital, especially in the context of declining share prices, signals a potentially troubling outlook that investors should factor into their decision-making processes.
What This Means for Investors
In summary, Ramaco Resources Inc METC is currently overvalued according to the GF Value™, which sets the fair value at $8.88 against a current market price of $11.90. With significant insider selling and a high forward P/E ratio, the stock's valuation appears precarious, especially in light of its cash-flow-negative status. Investors should proceed with caution and consider these factors in their analysis of METC moving forward. For further insights, visit the Ramaco Resources Inc (METC) stock page for detailed metrics and information.
Frequently Asked Questions
What is METC's GF Score™?
METC has a GF Score™ of 79/100, indicating above-average performance compared to its peers.
Is METC overvalued or undervalued?
METC is currently overvalued, with a GF Value™ estimate of $8.88 compared to the current price of $11.90, representing a 34.0% overvaluation.
What is METC's P/E ratio?
METC does not have a trailing P/E ratio due to being unprofitable, while the forward P/E stands at 1009.0x, suggesting unrealistic expectations for future earnings growth.
This stock alert was generated using automated technology and GuruFocus financial data to provide readers with timely and accurate market reporting. This content was reviewed by GuruFocus editorial team prior to publication. Please send any questions or comments about this story to [email protected].

