


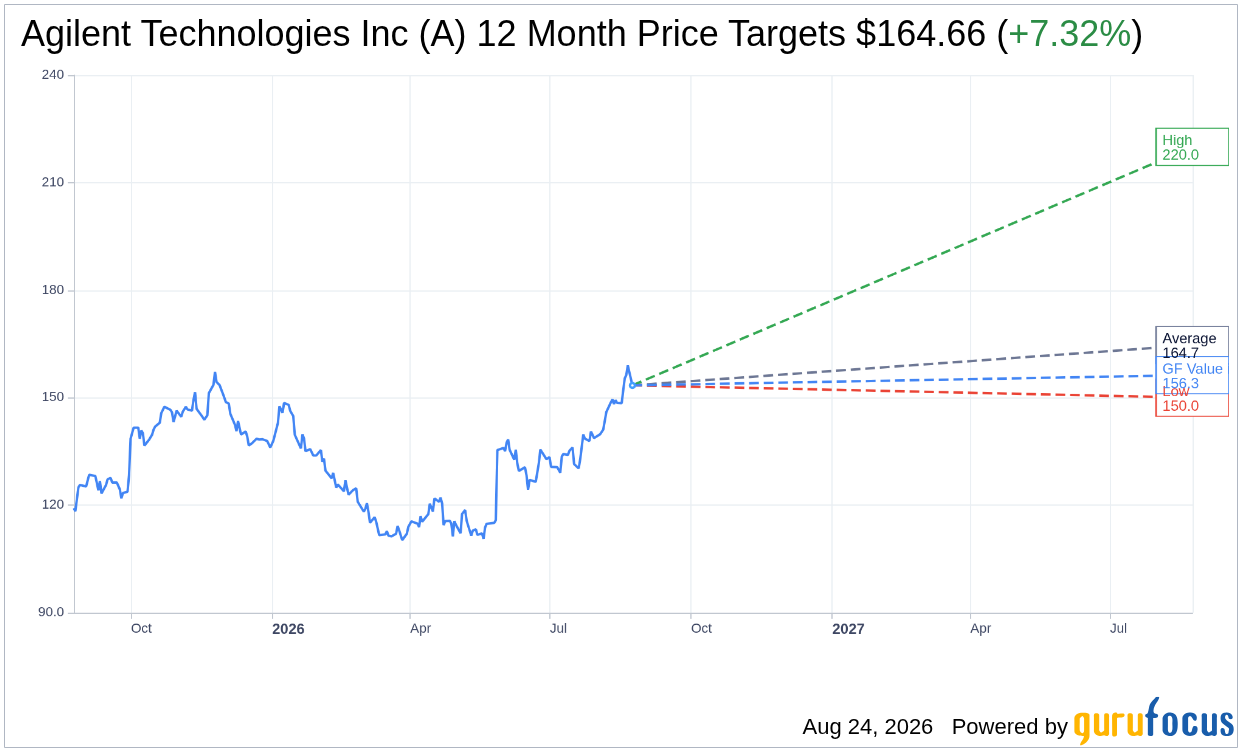
On August 24, 2026, Agilent Technologies Inc A shares fell 3.5% to $153.43, trading within a 52-week range of $108.35 to $160.51. The recent price movement has brought focus to the valuation of the stock.
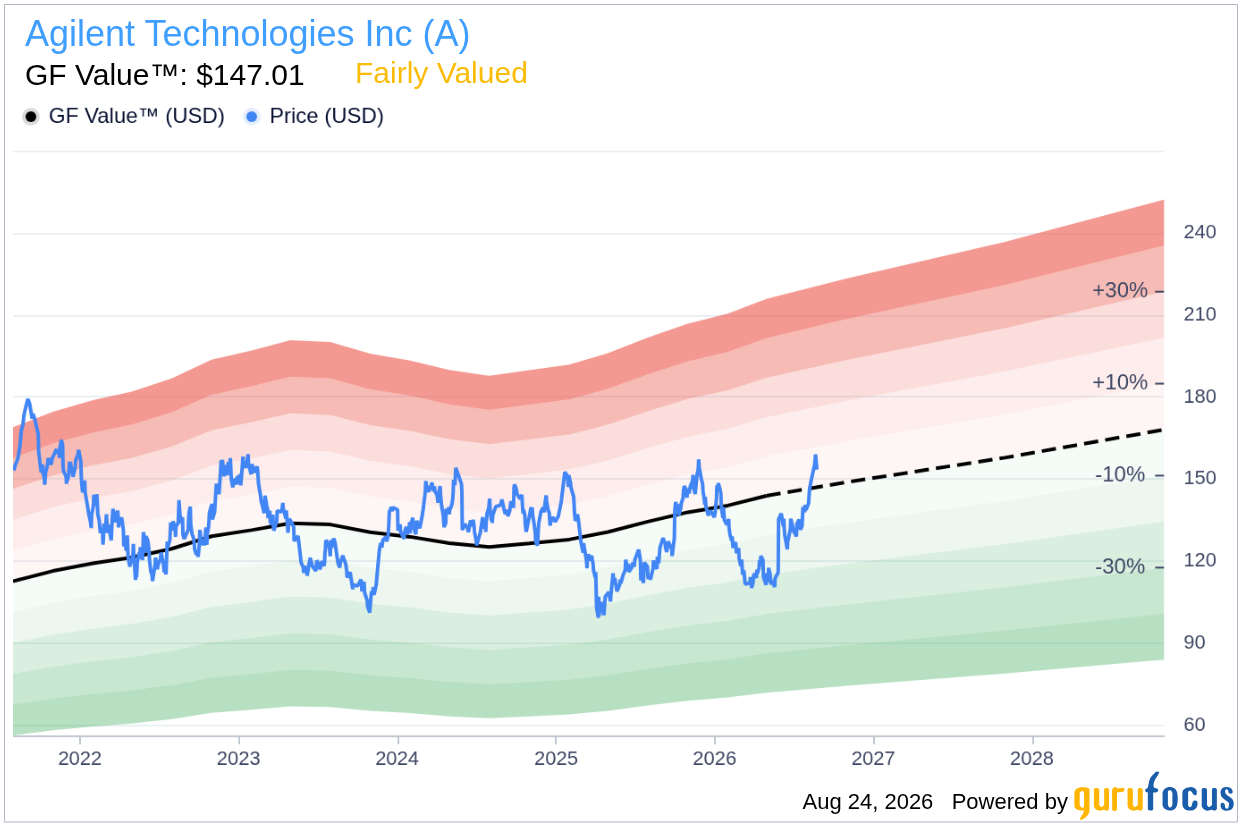
- GF Value™ verdict: Current price is $153.43 vs GF Value of $147.01, indicating the stock is 4.4% overvalued.
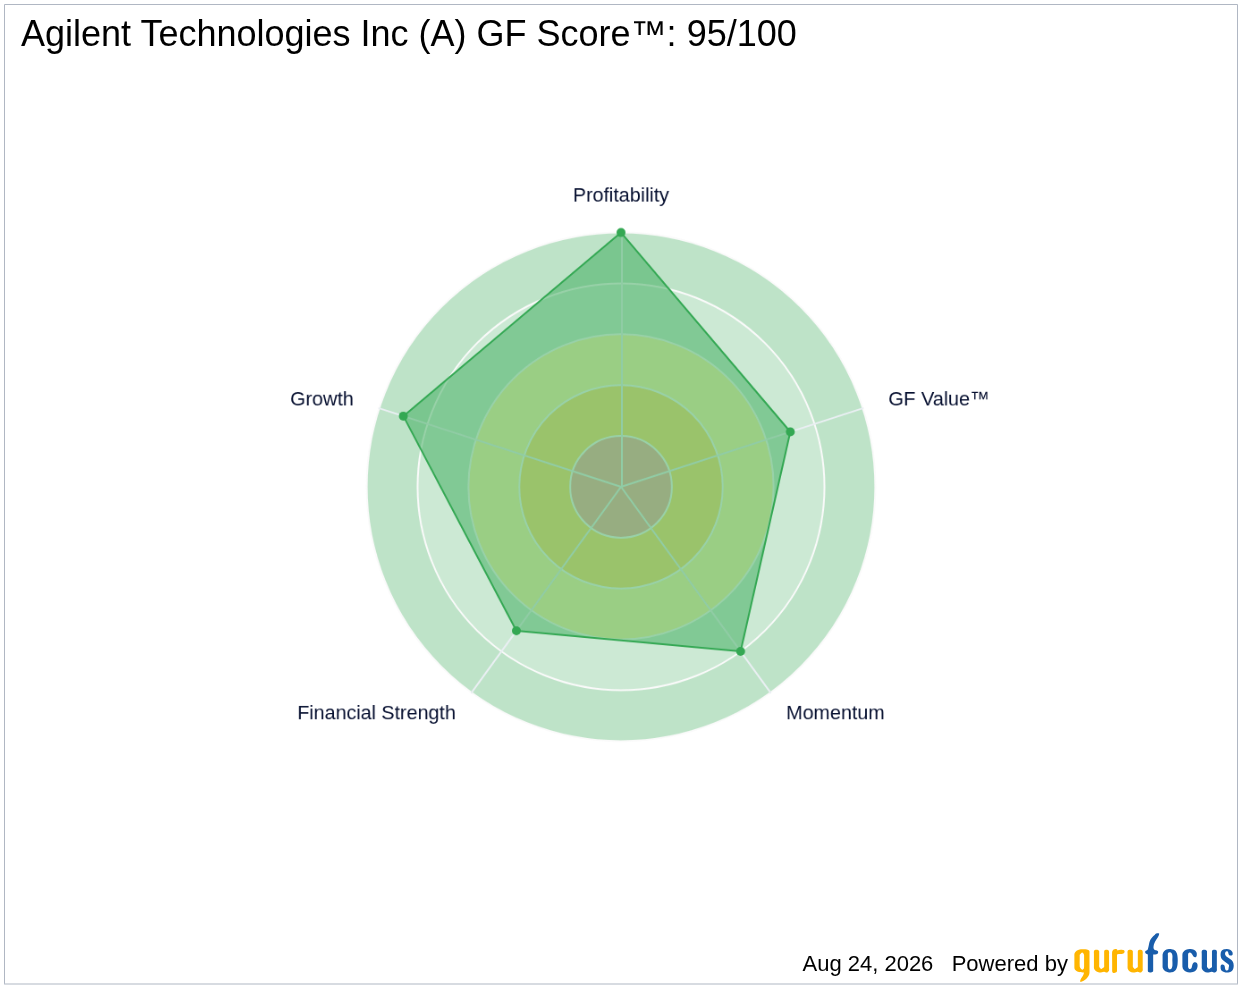
- GF Score™ is 95/100, reflecting strong overall performance across multiple metrics.
- Insider activity shows a significant sell-off, with insiders selling $3.3 million worth of shares in the past year, suggesting caution.
Is A Overvalued or Undervalued?
Agilent Technologies Inc A is currently trading at $153.43, which is above its GF Value™ estimate of $147.01, indicating that the stock is 4.4% overvalued. The GF Value™ is GuruFocus' proprietary intrinsic value estimate calculated based on historical trading multiples, past business growth, and future performance projections. Being overvalued raises concerns about potential downside risk if the market adjusts and the stock price aligns closer to its intrinsic value.
The GF Valuation label categorizes Agilent as fairly valued, but given the margin of safety is negative, this presents a cautionary note for potential investors. In an environment where market fluctuations can create volatility, understanding the valuation metrics becomes crucial for making informed decisions.
How Does A's Valuation Compare to Its History?
| Metric | Current | Historical |
|---|---|---|
| P/E (TTM) | 30.8x | 30.6x |
| Forward P/E | 23.2x | N/A |
Agilent's current P/E ratio of 30.8x is slightly above its 5-year median P/E of 30.6x, indicating that the stock is trading at a valuation that is slightly elevated compared to its historical norm. The forward P/E of 23.2x suggests more favorable earnings expectations in the near future. This P/E analysis aligns with the GF Value™ verdict, reinforcing the notion that Agilent is currently overvalued.
What Does A's GF Score™ Tell Us?
The GF Score™ is a comprehensive measure that evaluates a company's financial health, profitability, growth potential, valuation, and momentum. Agilent’s score of 95/100 indicates a strong performance, particularly in profitability and growth. The strongest sub-rank is the Profitability Rank at 10/10, reflecting exceptional earning capabilities, while the Valuation Rank at 7/10 suggests some caution regarding current pricing.
| Metric | Rating |
|---|---|
| GF Score™ | 95 |
| Financial Strength | 7/10 |
| Profitability | 10/10 |
| Growth | 9/10 |
| Valuation | 7/10 |
| Momentum | 8/10 |
The combination of a high GF Score™ and exceptional profitability signals that Agilent is performing well operationally. However, the moderate valuation rank indicates that while the company is strong, the current price may not offer sufficient margin for safety, suggesting a need for careful consideration before taking positions.
What Are Gurus and Insiders Doing with A?
Currently, 9 gurus hold shares of Agilent Technologies Inc, with 4 of them adding to their positions while 7 have trimmed their holdings in recent quarters. This mixed signal reflects a cautious approach among institutional investors, as they adjust their exposure to the stock amid its current valuation.
In addition, insider activity has revealed that insiders sold $3.3 million worth of shares over the past 12 months with no buying activity reported. This pattern of selling by insiders can be interpreted as a lack of confidence in the stock's near-term performance, which further underscores the importance of evaluating the current valuation critically.
What This Means for Investors
In summary, Agilent Technologies Inc A is currently considered overvalued based on its GF Value™ assessment, which places its fair value at $147.01 against a market price of $153.43. Investors should proceed with caution, given the potential risks associated with investing at elevated valuations, particularly in light of recent insider selling. For further details, you can visit the Agilent Technologies Inc (A) stock page to explore more about its performance and valuation metrics.
Frequently Asked Questions
What is A's GF Score™?
Agilent Technologies Inc has a GF Score™ of 95/100, indicating strong overall performance across various financial metrics.
Is A overvalued or undervalued?
A is currently overvalued, with a GF Value™ of $147.01 compared to its market price of $153.43.
What is A's P/E ratio?
A's P/E ratio is 30.8x, which is slightly above its 5-year median of 30.6x, indicating a higher valuation compared to its historical average.
This stock alert was generated using automated technology and GuruFocus financial data to provide readers with timely and accurate market reporting. This content was reviewed by GuruFocus editorial team prior to publication. Please send any questions or comments about this story to [email protected].

