


On August 24, 2026, GDS Holdings Ltd GDS shares fell by 3.3% to a current price of $31.75, continuing a downward trend reflected by a 52-week range of $26.97 to $48.61. This movement underscores the company's recent struggles amidst broader market conditions.
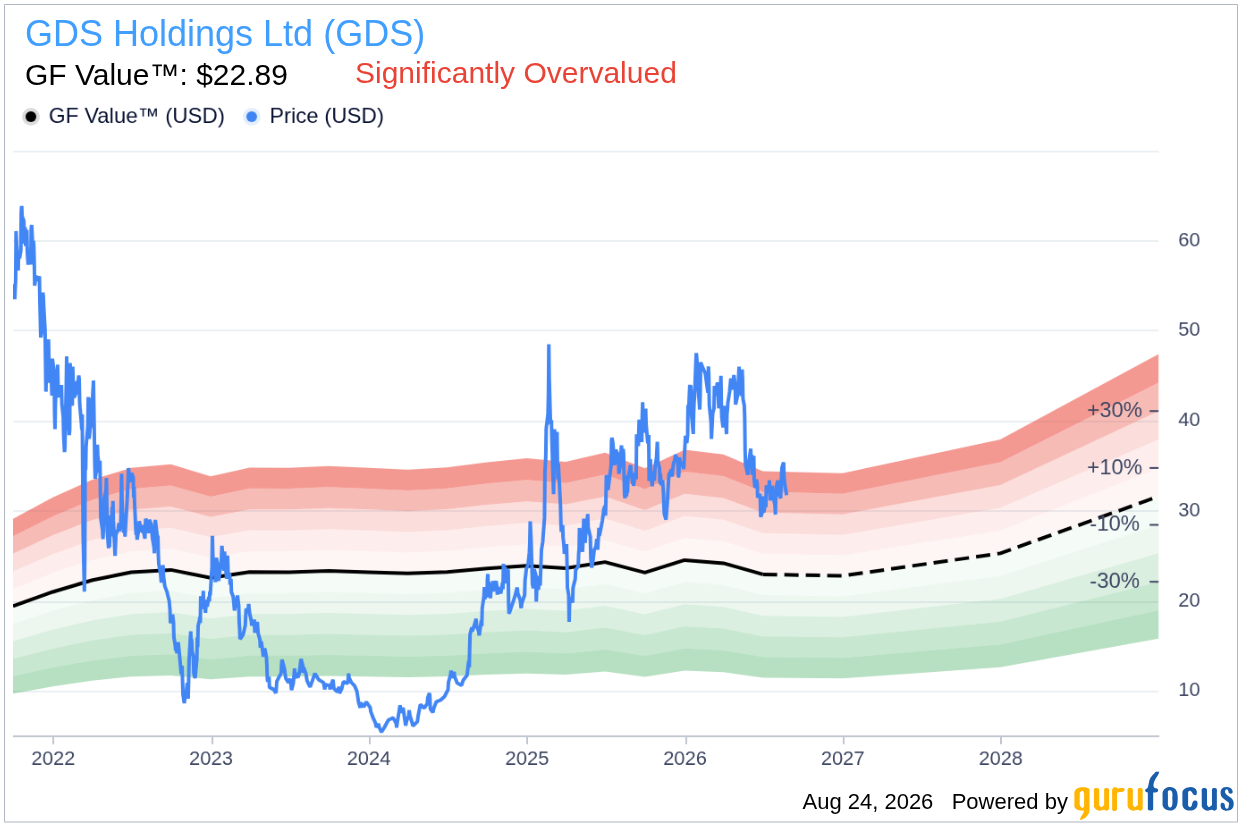
- GF Value™ verdict: Current price of $31.75 vs GF Value™ of $22.89 indicates a 38.7% overvaluation.
- GF Score™: 64/100, suggesting an above-average performance relative to peers.
- Most notable signal: Insider activity shows $1.7M in shares sold over the past 12 months, with no buying activity reported.
Is GDS Overvalued or Undervalued?
GDS Holdings Ltd currently trades at a significant premium to its estimated intrinsic value, as indicated by the GF Value™ of $22.89. This suggests a potential downside risk of 38.7% from the current price. The GF Value™ is GuruFocus' proprietary estimate of a stock's fair value, calculated based on historical trading multiples, past business growth, and future performance estimates. Given that GDS is unprofitable and cash-flow negative, this valuation metric should be interpreted with caution.
With a GF Valuation label of "Significantly Overvalued," the current market price poses a risk to potential investors. The disparity between the current price and GF Value™ raises concerns about the sustainability of GDS's valuation in a volatile market environment. Investors are advised to consider this extreme reading as a directional warning rather than a precise benchmark.
How Does GDS's Valuation Compare to Its History?
| Metric | Current | Historical |
|---|---|---|
| P/E (TTM) | 14.8x | 11.2x |
| Forward P/E | 49.4x | N/A |
The current P/E (TTM) of 14.8x is approximately 32% above its 5-year median P/E of 11.2x, indicating that the stock is trading above its historical valuation levels. This P/E analysis aligns with the GF Value™ verdict of overvaluation, suggesting that GDS Holdings Ltd fails to meet historical valuation benchmarks, further reinforcing the cautionary stance regarding its current pricing.
What Does GDS's GF Score™ Tell Us?
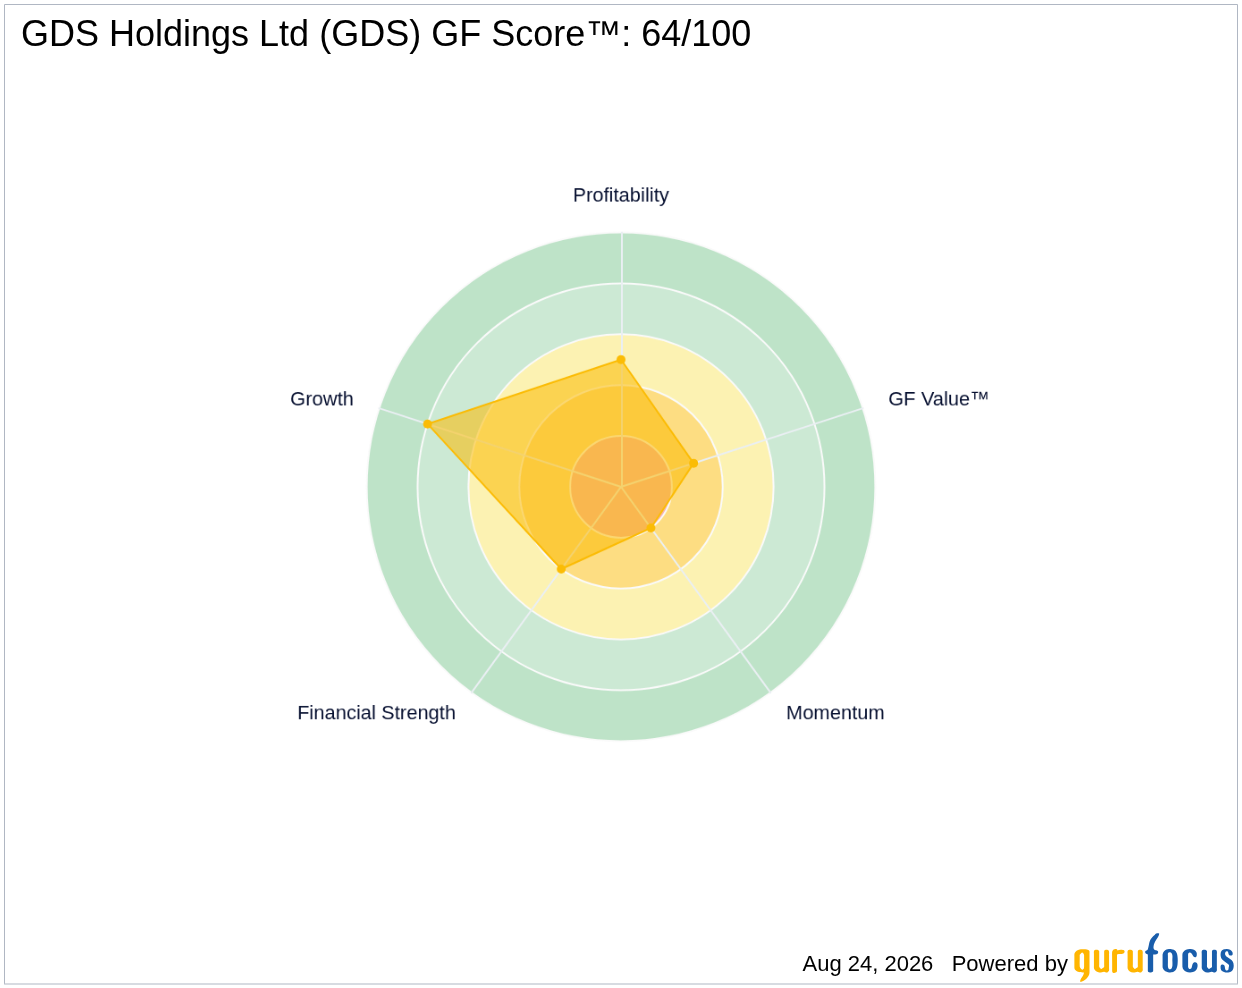
The GF Score™ is a comprehensive measure that evaluates a company's financial health, profitability, growth, valuation, and momentum. GDS's score of 64/100 indicates an above-average performance in comparison to its industry peers, with its strongest rank in growth and weakest in valuation.
| Metric | Rating |
|---|---|
| GF Score™ | 64/100 |
| Financial Strength | 4/10 |
| Profitability | 5/10 |
| Growth | 8/10 |
| Valuation | 3/10 |
| Momentum | 2/10 |
The analysis of the GF Score™ reveals that GDS's strongest area is growth, scoring 8 out of 10, indicating promising potential for expansion. However, the weakest area is valuation, scoring just 3 out of 10, which aligns with the concerns raised by the GF Value™ assessment. This combination suggests that while the company may have growth prospects, its current valuation is not justified based on its financial performance.
What Are Gurus and Insiders Doing with GDS?
Currently, four gurus hold positions in GDS, with three adding to their stakes and two trimming their holdings in recent quarters. This activity suggests a mixed sentiment among professional investors regarding the company's future prospects. Notably, insider activity has been predominantly selling, with $1.7M in shares sold over the past 12 months and no reported buying. This trend raises questions about insider confidence in the company's future performance and may indicate caution among those with intimate knowledge of its operations.
What This Means for Investors
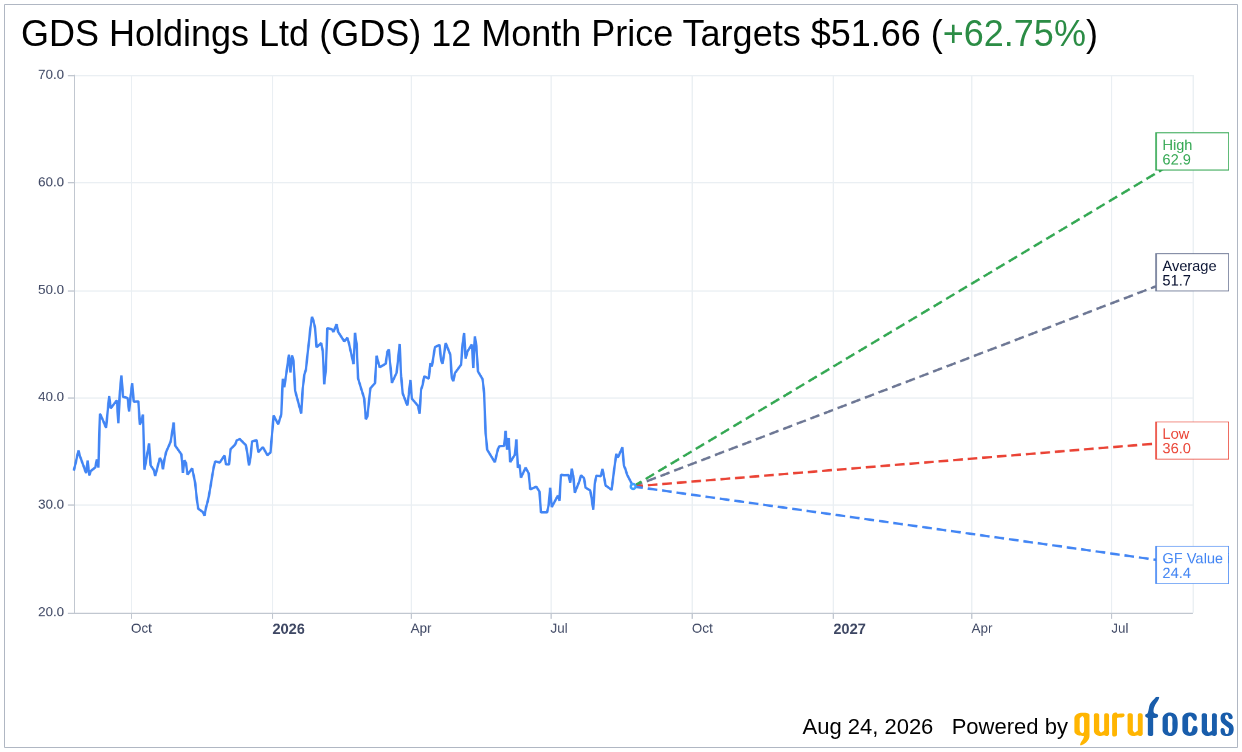
Based on the analysis above, GDS Holdings Ltd appears to be significantly overvalued relative to its intrinsic value as estimated by GF Value™, suggesting a potential downside risk for investors. The combination of a high current price, poor valuation rank, and negative insider activity signals caution for potential investors considering entering or holding positions in this stock.
For those interested in a deeper dive into GDS Holdings Ltd GDS, please visit the GDS Holdings Ltd (GDS) stock page for more insights on its financials and performance, or explore the GF Value™ page for a detailed evaluation of its intrinsic value.
Frequently Asked Questions
What is GDS's GF Score™?
GDS's GF Score™ is 64/100, indicating above-average performance relative to its peers, suggesting it has strengths in certain areas, particularly growth.
Is GDS overvalued or undervalued?
GDS is considered overvalued, with a GF Value™ estimate of $22.89 compared to a current price of $31.75, indicating a 38.7% overvaluation.
What is GDS's P/E ratio?
GDS's P/E (TTM) is 14.8x, which is 32% above its 5-year median P/E of 11.2x, suggesting it is trading at a premium compared to its historical valuation.
This stock alert was generated using automated technology and GuruFocus financial data to provide readers with timely and accurate market reporting. This content was reviewed by GuruFocus editorial team prior to publication. Please send any questions or comments about this story to [email protected].

