


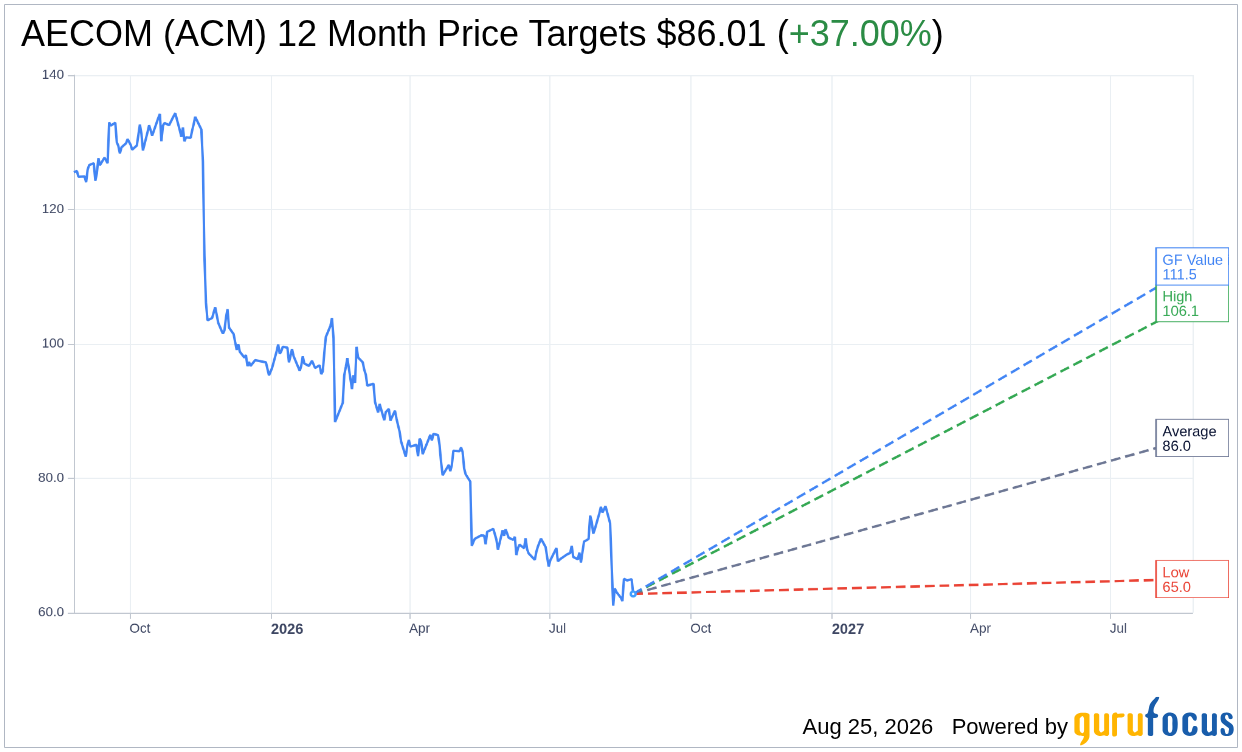
On August 25, 2026, AECOM ACM shares fell 3.4% to $62.78, continuing a troubling trend for the stock, which has seen a 52-week range between $60.35 and $135.52. The recent performance has been disappointing, with a year-to-date decline of 33.4% and a staggering 48.3% drop over the past year.
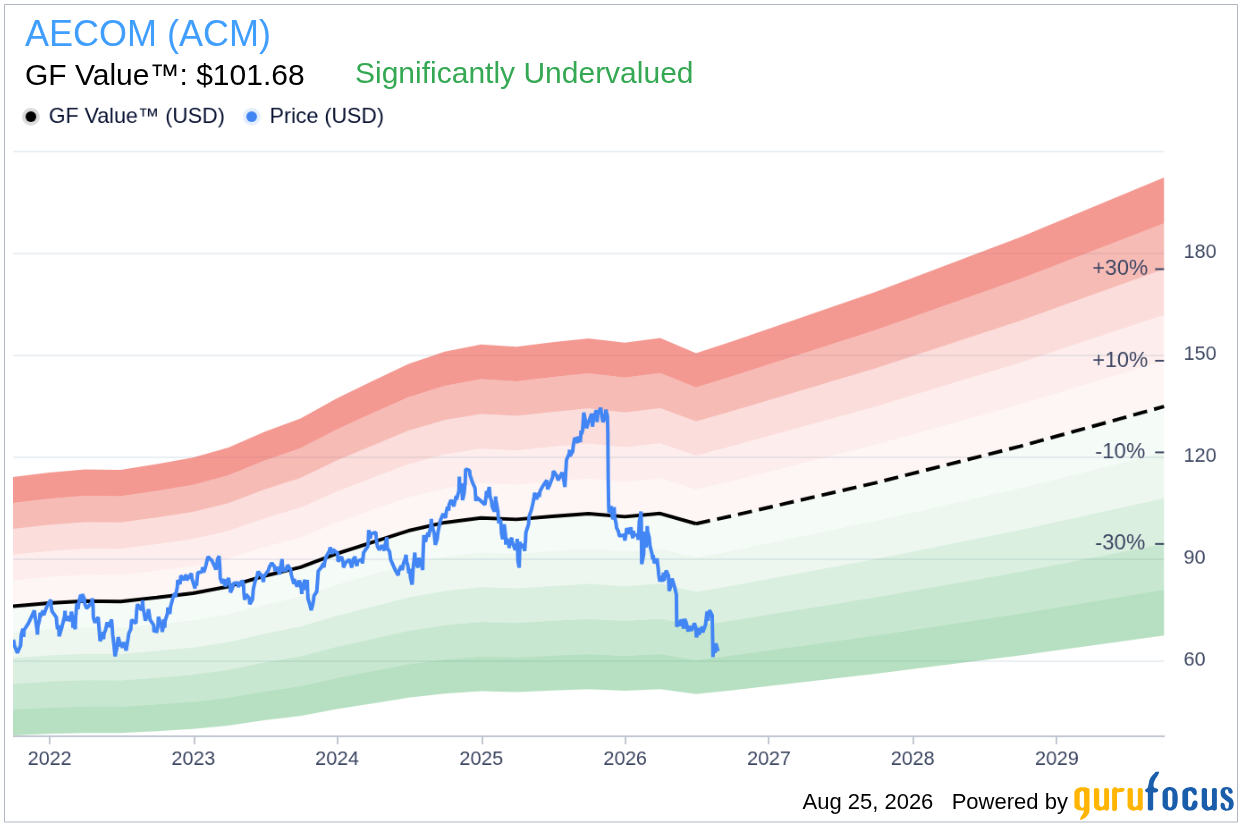
- GF Value™ verdict: Current price is $62.78, which is 38.3% below the GF Value™ estimate of $101.68.
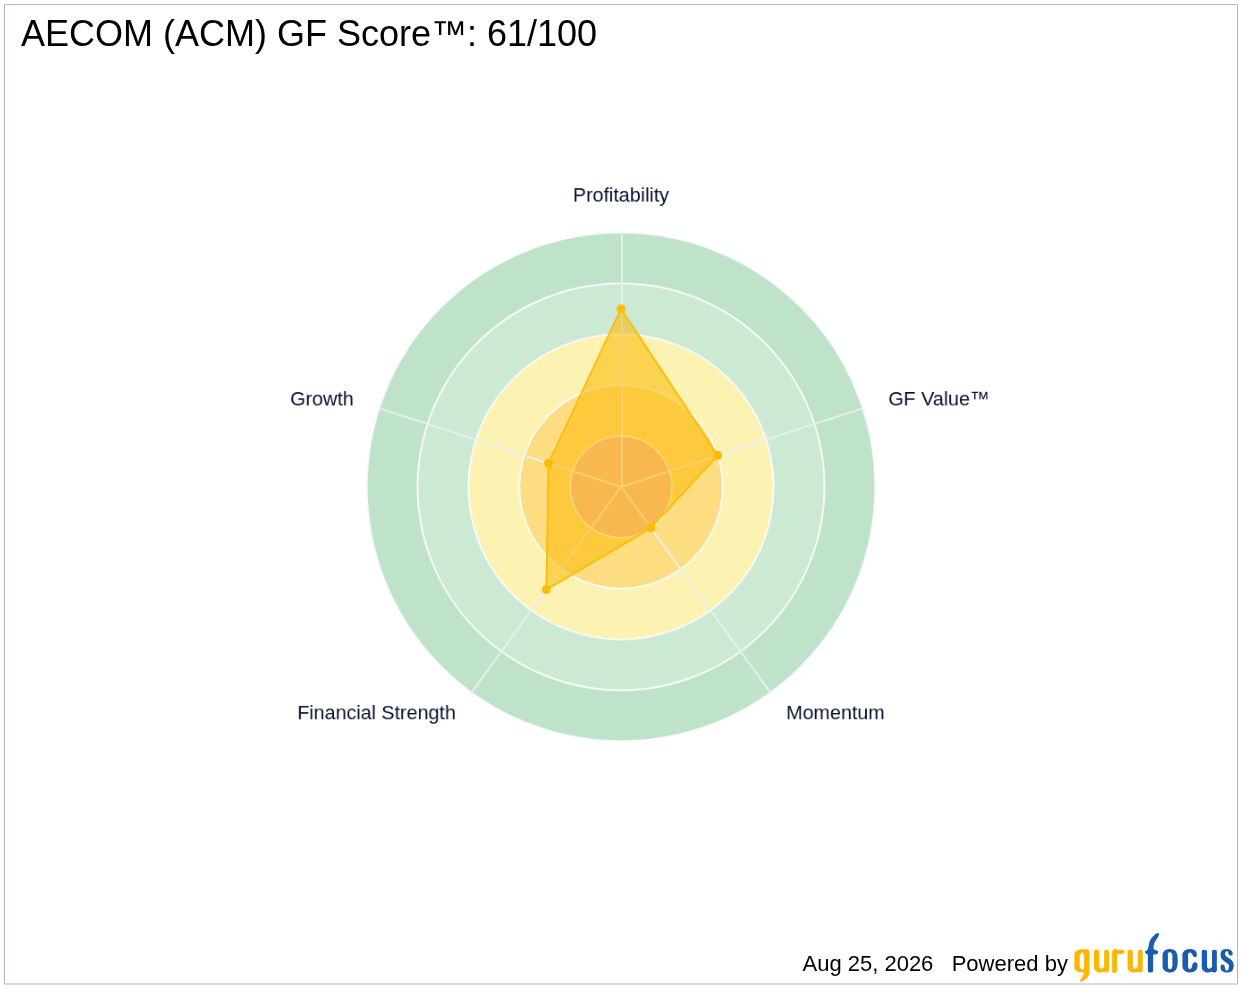
- GF Score™ of 61/100 indicates that AECOM is above average compared to its peers.
- Notable signal: Insiders have sold $2.5M more than they have bought over the past 12 months, pointing to potential concerns about future performance.
Is ACM Overvalued or Undervalued?
With AECOM's current price of $62.78 positioned significantly below the GF Value™ estimate of $101.68, the stock appears undervalued by approximately 38.3%. This discrepancy presents a potential opportunity for investors, as the GF Valuation label categorizes AECOM as significantly undervalued. GF Value™ represents GuruFocus's intrinsic value estimate based on historical trading multiples, past business growth, and anticipated future performance. The margin of safety provided by this valuation suggests that the stock could offer substantial upside potential if the market corrects its pricing.
However, caveats exist; AECOM has faced considerable downward pressure on its stock price, as indicated by its year-to-date and one-year performance metrics. While the undervaluation is appealing, the persistent selling by insiders may reflect concerns that could impact future performance, warranting caution from potential investors.
How Does ACM's Valuation Compare to Its History?
| Metric | Current | Historical |
|---|---|---|
| P/E (TTM) | 28.8x | 35.6x |
| Forward P/E | 10.1x | N/A |
Currently, AECOM's P/E ratio of 28.8x is significantly below its 5-year median of 35.6x, which indicates that the stock is trading at a discount relative to its historical valuation. This finding aligns with the GF Value™ assessment, reinforcing the notion that AECOM is undervalued based on its earnings potential.
What Does ACM's GF Score™ Tell Us?
The GF Score™ measures a stock's long-term performance potential based on various factors including financial strength, profitability, growth, valuation, and momentum. AECOM's GF Score™ of 61/100 suggests that it is positioned above average in terms of overall investment quality. The strongest sub-rank is its profitability rank of 7/10, indicating solid profit generation capabilities, while its growth rank of 3/10 reveals challenges in expanding its earnings.
| Metric | Rating |
|---|---|
| GF Score™ | 61/100 |
| Financial Strength | 5/10 |
| Profitability | 7/10 |
| Growth | 3/10 |
| Valuation | 4/10 |
| Momentum | 2/10 |
The combination of these scores illustrates AECOM's strengths in profitability but highlights weaknesses in growth and momentum. While the profitability rank suggests that the company has been successful in generating profits, the low growth and momentum scores may raise concerns about its ability to sustain that profitability in the long term.
What Are Gurus and Insiders Doing with ACM?
Currently, 7 gurus hold shares of AECOM, with 6 of them having increased their positions in recent quarters, while 3 have trimmed their holdings. This indicates a generally positive sentiment among institutional investors. However, insider activity has been mixed; over the past 12 months, insiders purchased $0.7M worth of shares but sold $3.2M, resulting in a net selling of $2.5M. This net selling suggests that insiders may not be confident in the stock's near-term prospects, a sentiment that investors should consider when evaluating AECOM's future.
What This Means for Investors
Taking into account the GF Value™ analysis, AECOM appears to be undervalued at its current price of $62.78, especially given its significant margin of safety relative to the GF Value™ estimate of $101.68. However, the concerning trends in insider selling and weak growth momentum cannot be overlooked. Investors may find potential in AECOM, but they should remain vigilant about the risks involved. For further details, visit the AECOM ACM stock page for a comprehensive analysis.
Frequently Asked Questions
What is ACM's GF Score™?
ACM has a GF Score™ of 61/100, indicating that it is above average compared to its peers in terms of overall investment quality.
Is ACM overvalued or undervalued?
ACM is currently undervalued, with a GF Value™ estimate of $101.68 compared to its current price of $62.78, suggesting a 38.3% upside potential.
What is ACM's P/E ratio?
ACM's P/E (TTM) ratio is 28.8x, which is below its 5-year median of 35.6x, indicating that the stock is trading at a discount relative to its historical earnings valuation.
This stock alert was generated using automated technology and GuruFocus financial data to provide readers with timely and accurate market reporting. This content was reviewed by GuruFocus editorial team prior to publication. Please send any questions or comments about this story to [email protected].

