


On August 31, 2026, Cushman & Wakefield Ltd CWK shares fell 4.5% to $13.49. The stock has shown a 52-week range between $11.57 and $17.40, highlighting significant volatility. This recent decline adds to a year-to-date loss of 16.7% and a year-over-year decline of 14.5%.
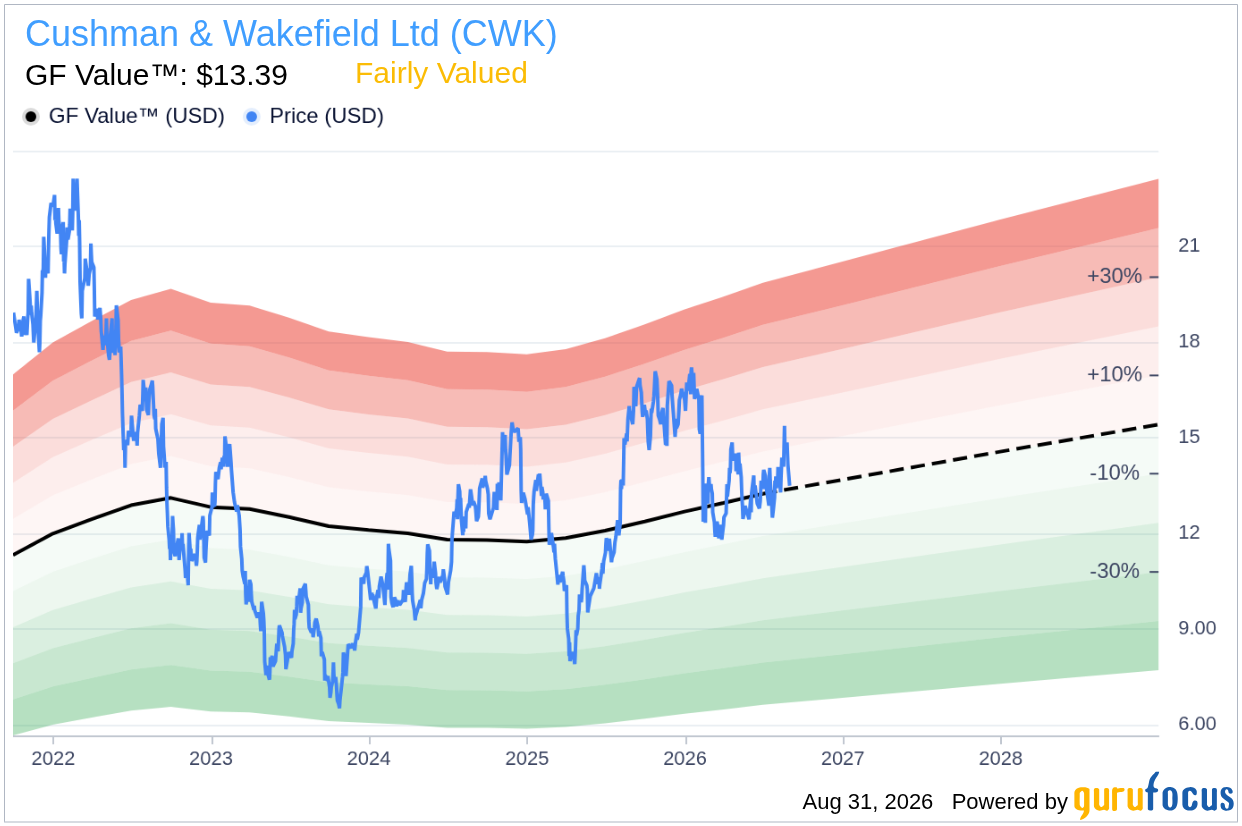
- GF Value™ verdict: CWK is currently priced at $13.49, which is 0.7% above the GF Value™ estimate of $13.39, indicating it is slightly overvalued.
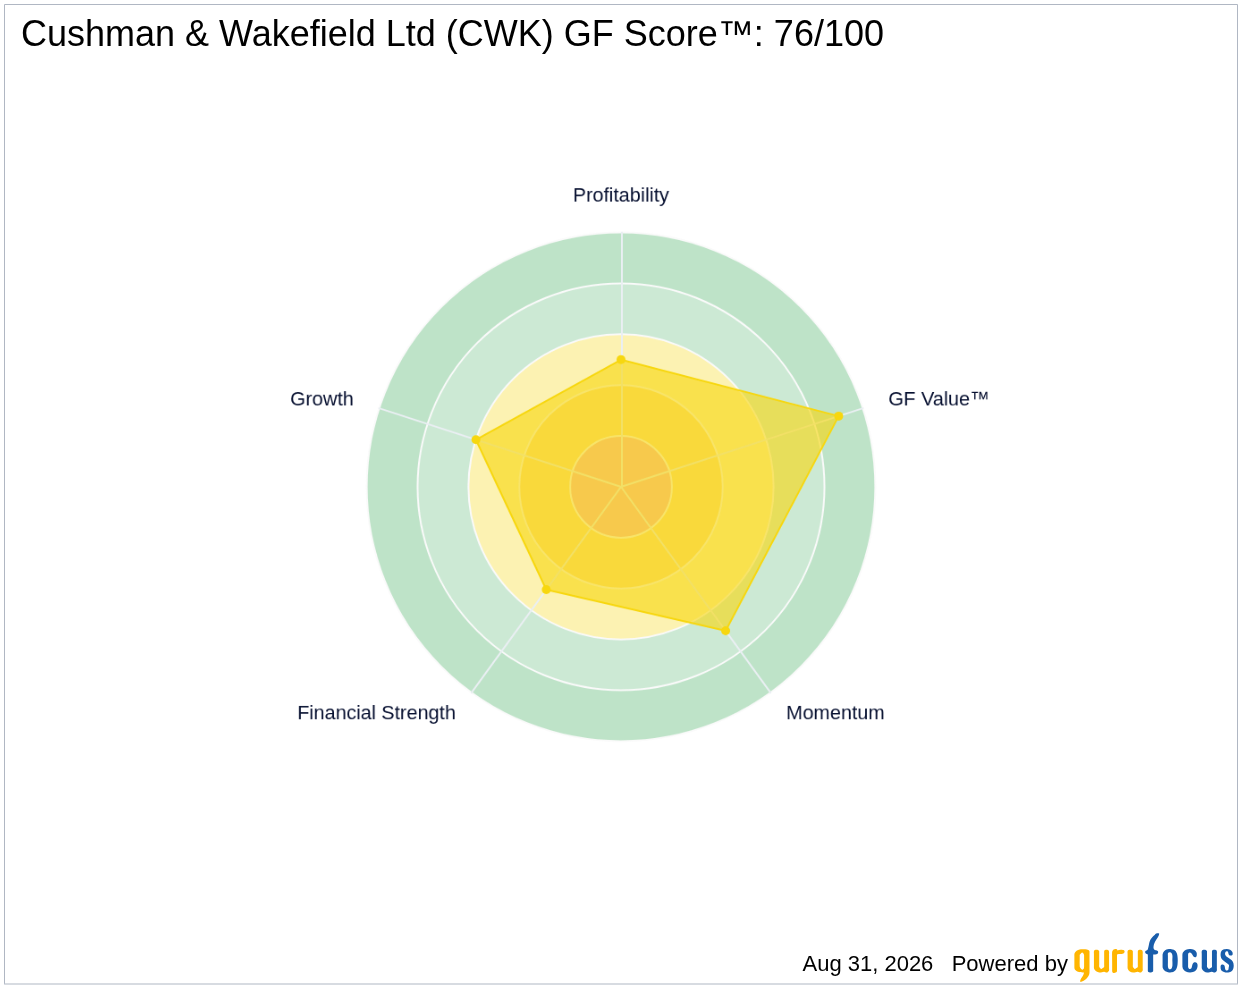
- GF Score™: CWK has a GF Score™ of 76/100, which categorizes it as above average compared to peers.
- Most notable signal: Insiders sold $0.9M worth of shares over the past 12 months, with no buying activity.
Is CWK Overvalued or Undervalued?
According to the GF Value™, CWK is currently slightly overvalued with a price of $13.49 compared to its estimated fair value of $13.39. This indicates a narrow margin of safety for potential investors, as the stock is only 0.7% above its intrinsic value estimate. The GF Valuation label categorizes CWK as "Fairly Valued," suggesting that the stock price is reasonably aligned with its financial fundamentals. However, the slight overvaluation indicates that there may be risks associated with entering a position at this price point, especially given the recent trend of declining prices.
The GF Value™ is GuruFocus' proprietary estimate of a company's intrinsic value, which is derived from various factors including historical trading multiples, past business growth, and future performance projections. In the case of CWK, the current price does not present a compelling buying opportunity, particularly with the existing market trends indicating downward pressure.
How Does CWK's Valuation Compare to Its History?
| Metric | Current | Historical |
|---|---|---|
| P/E (TTM) | 46.5x | 21.2x |
| Forward P/E | 9.2x | N/A |
The current P/E ratio of 46.5x is significantly above its 5-year median P/E of 21.2x, marking an increase of 119%. This elevated P/E suggests that CWK is trading at a premium compared to its historical valuation metrics. The forward P/E of 9.2x indicates a more favorable estimate for future earnings, but the stark difference between current and historical P/E ratios is a signal that may not align with the GF Value™ verdict of being fairly valued. Thus, the P/E analysis reinforces the notion that CWK may be overvalued at its current price.
What Does CWK's GF Score™ Tell Us?
The GF Score™ measures a company's financial health and growth potential based on various criteria, including profitability, financial strength, growth prospects, valuation, and momentum. CWK's score of 76/100 highlights its above-average performance in these areas, though it also reveals some weaknesses.
| Metric | Rating |
|---|---|
| GF Score™ | 76 |
| Financial Strength | 5/10 |
| Profitability | 5/10 |
| Growth | 6/10 |
| Valuation | 9/10 |
| Momentum | 7/10 |
The strongest sub-rank for CWK is its Valuation rank of 9/10, suggesting it has solid valuation metrics compared to its peers. Conversely, the Financial Strength and Profitability ranks of 5/10 indicate that there are areas in need of improvement, particularly in maintaining a strong balance sheet and generating consistent profits. Overall, while CWK shows promise in valuation, the financial and profitability metrics could raise concerns for potential investors.
What Are Gurus and Insiders Doing with CWK?
Currently, four gurus hold CWK stock, with three increasing their positions and two reducing their stakes in recent quarters. This mixed signal from institutional investors indicates a degree of interest in the stock, albeit with caution from some.
In terms of insider activity, the sale of $0.9M worth of shares by insiders over the past 12 months, with no buying, suggests a lack of confidence among company executives regarding the stock's future performance. This pattern may raise red flags for potential investors, as insiders often have a better understanding of the company's prospects than outside investors.
What This Means for Investors
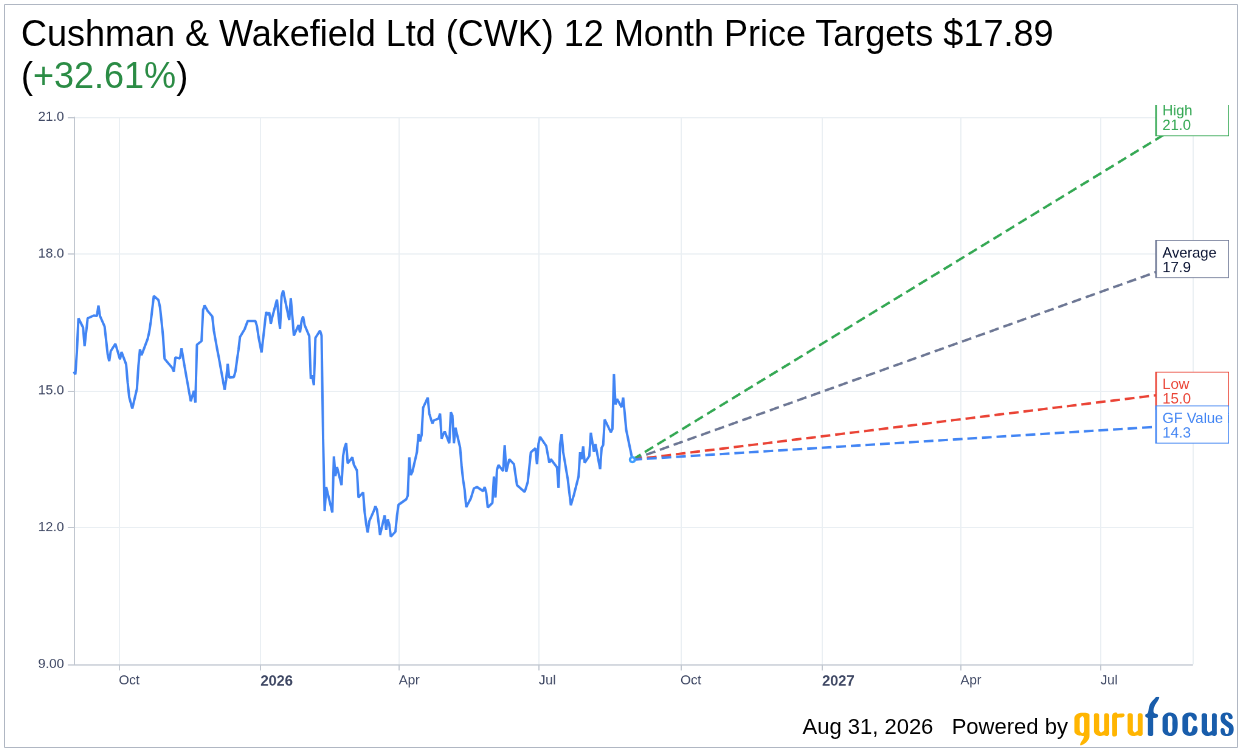
In summary, Cushman & Wakefield Ltd CWK is currently assessed as slightly overvalued based on the GF Value™ estimate of $13.39 compared to its market price of $13.49. While the stock shows above-average potential according to its GF Score™, the significant gap between its current P/E and historical median P/E raises concerns regarding valuation sustainability. As such, potential investors should proceed with caution and consider the current market dynamics and insider sentiment before making any investment decisions.
For more detailed insights and further analysis, visit the Cushman & Wakefield Ltd CWK stock page, or check out the GF Value™ page for more information.
Frequently Asked Questions
What is CWK's GF Score™?
CWK has a GF Score™ of 76/100, indicating that it performs above average compared to its peers.
Is CWK overvalued or undervalued?
Based on the GF Value™ estimate, CWK is slightly overvalued at its current price of $13.49, which is 0.7% above the fair value of $13.39.
What is CWK's P/E ratio?
CWK's P/E (TTM) ratio is 46.5x, which is significantly higher than its 5-year median P/E of 21.2x, indicating that the stock is trading at a premium compared to its historical valuation.
This stock alert was generated using automated technology and GuruFocus financial data to provide readers with timely and accurate market reporting. This content was reviewed by GuruFocus editorial team prior to publication. Please send any questions or comments about this story to [email protected].

