


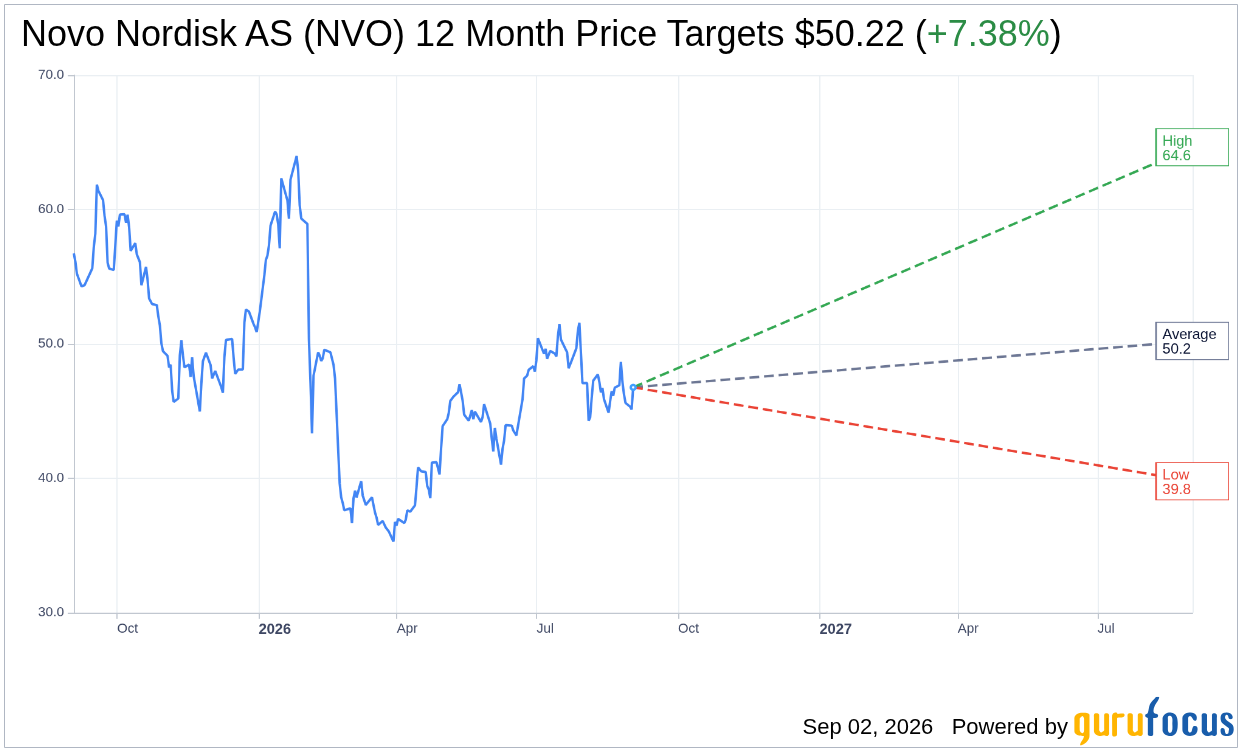
On September 02, 2026, Novo Nordisk AS NVO shares rose 3.7% today, closing at $46.77. This movement is notable within the context of the stock's 52-week range, which has seen a low of $35.12 and a high of $64.16. The recent price uptick comes amid a year-to-date decline of -3.6% and a more significant 1-year drop of -13.1%.
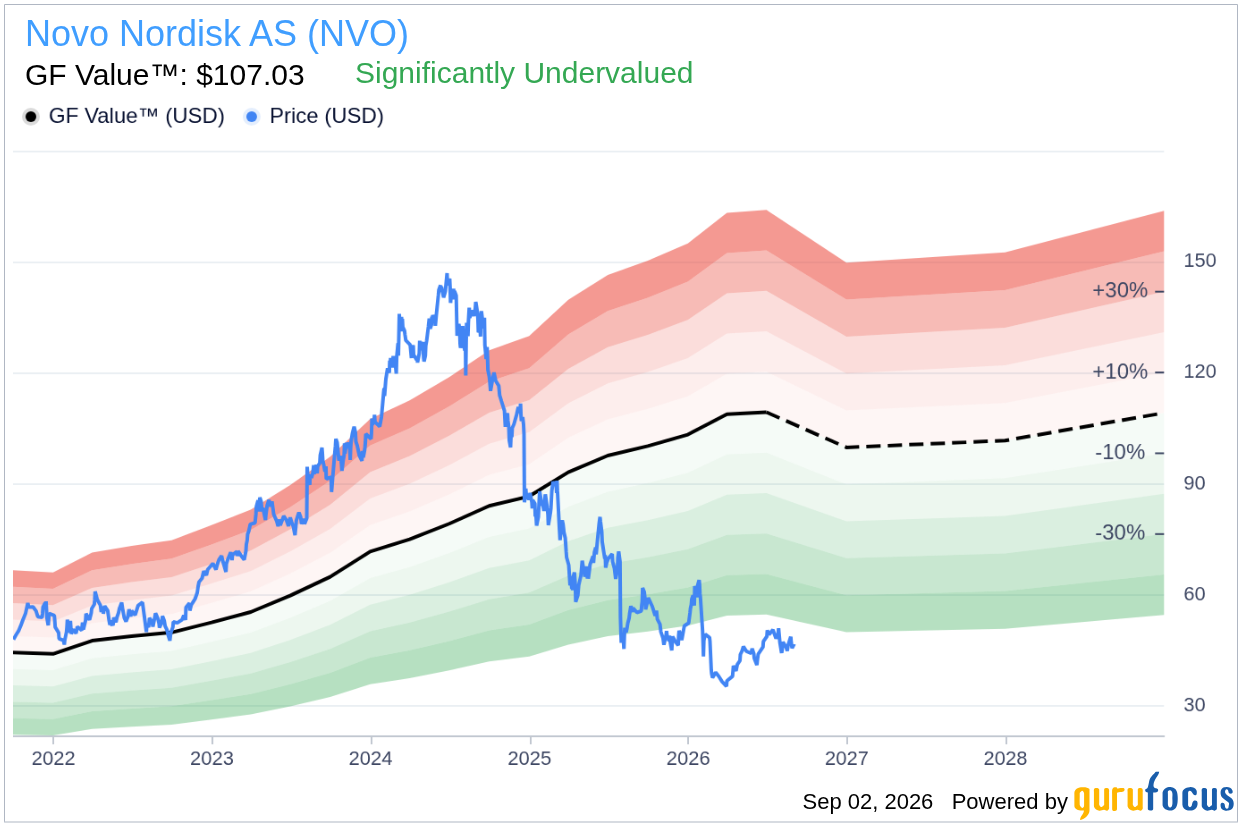
- GF Value™ verdict: Current price of $46.77 is 56.3% below the GF Value™ of $107.03, indicating substantial undervaluation.
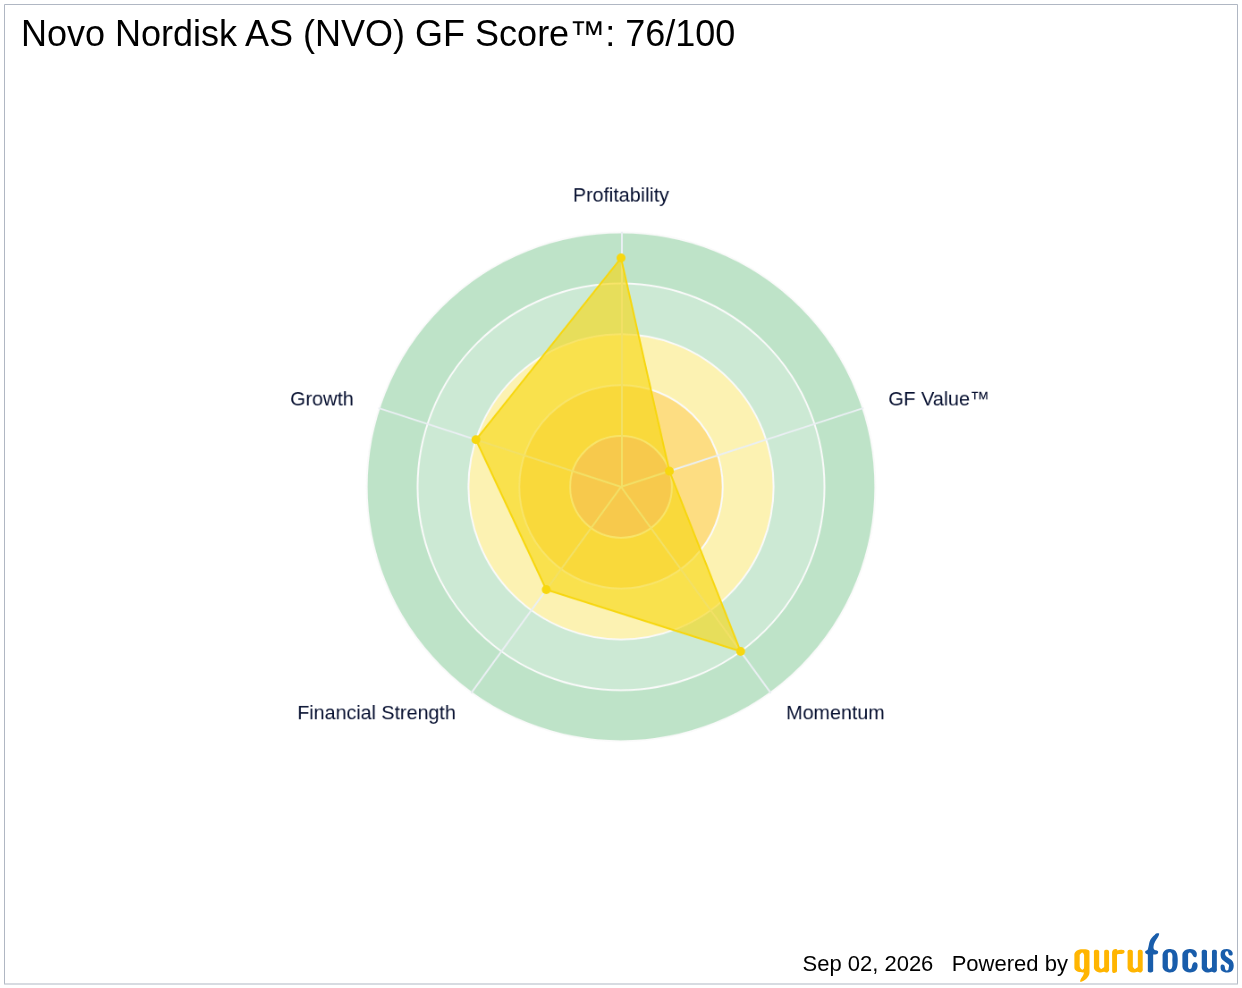
- GF Score™: The stock holds a score of 76/100, suggesting it is above average compared to its peers.
- Notable signal: Insider activity shows no transactions in the past 12 months, signaling stable internal confidence.
Is NVO Overvalued or Undervalued?
With a GF Value™ estimated at $107.03, Novo Nordisk AS NVO is currently trading at $46.77, reflecting a significant margin of safety of 56.3%. This substantial gap between the current market price and the GF Value™ indicates a promising opportunity for those considering the stock. The GF Value™ is a proprietary intrinsic value assessment that GuruFocus calculates based on historical trading multiples, past business growth, and projections of future performance. Its significance lies in offering investors a clearer perspective on whether a stock is fairly valued, undervalued, or overvalued.
The GF Valuation label categorizes NVO as significantly undervalued, implying that the market has not fully recognized its potential. While the current valuation presents an attractive opportunity, investors should remain aware of the inherent risks associated with fluctuations in market sentiment and economic conditions that could affect the stock's recovery.
How Does NVO's Valuation Compare to Its History?
| Metric | Current | Historical |
|---|---|---|
| P/E (TTM) | 11.5x | 35.4x |
| Forward P/E | 13.3x | N/A |
Currently, Novo Nordisk's P/E (TTM) ratio stands at 11.5x, which is significantly lower than its 5-year median P/E of 35.4x. This indicates that the stock is trading at a price-to-earnings multiple that is 68% below its historical average. The forward P/E of 13.3x suggests some expected improvement, but still aligns with the overall theme of undervaluation. This analysis corroborates the GF Value™ verdict, reinforcing the notion that NVO is currently undervalued in relation to its historical performance metrics.
What Does NVO's GF Score™ Tell Us?
The GF Score™ is a comprehensive metric that evaluates the overall quality of a stock based on various critical factors, including financial strength, profitability, growth, valuation, and momentum. Novo Nordisk's score of 76/100 indicates above-average performance, with its strongest sub-rank in profitability and a notable weakness in valuation.
| Metric | Rating |
|---|---|
| GF Score™ | 76 |
| Financial Strength | 5/10 |
| Profitability | 9/10 |
| Growth | 6/10 |
| Valuation | 2/10 |
| Momentum | 8/10 |
In summary, the strong profitability rank of 9/10 highlights NVO's capacity to generate significant earnings, while the valuation rank of 2/10 indicates a considerable disconnect between the stock’s price and its perceived value. This combination of strengths and weaknesses suggests that while the company is performing well operationally, its stock price may not reflect that success adequately.
What Are Gurus and Insiders Doing with NVO?
Currently, 13 gurus hold positions in Novo Nordisk AS, with 5 increasing their stakes and 7 trimming their holdings in recent quarters. This activity suggests a mix of confidence and caution among institutional investors, potentially reflecting varying outlooks on the company's future performance.
Moreover, the absence of insider transactions in the past 12 months signals a stable internal environment, which may indicate that management is confident in the company's future prospects. The mixed signals from guru activity, coupled with a lack of insider buying or selling, suggest that investors should weigh these insights carefully when considering their positions in NVO.
What This Means for Investors
Based on the current analysis, Novo Nordisk AS NVO appears to be undervalued according to the GF Value™ assessment, offering a significant upside potential. The combination of a strong profitability rank, a favorable GF Score™, and the substantial margin of safety derived from the GF Value™ suggests that while there are opportunities, investors should remain cognizant of market volatility and external factors that could impact the stock's performance. For further details on this stock, you can visit the Novo Nordisk AS (NVO) stock page.
Frequently Asked Questions
What is NVO's GF Score™?
NVO's GF Score™ is 76/100, indicating that it is above average compared to its peers based on various quality metrics.
Is NVO overvalued or undervalued?
NVO is currently undervalued, with a GF Value™ of $107.03 compared to its market price of $46.77, reflecting a significant margin of safety.
What is NVO's P/E ratio?
NVO's P/E (TTM) ratio is 11.5x, which is 68% below its 5-year median of 35.4x, indicating that the stock is trading well below its historical valuation.
This stock alert was generated using automated technology and GuruFocus financial data to provide readers with timely and accurate market reporting. This content was reviewed by GuruFocus editorial team prior to publication. Please send any questions or comments about this story to [email protected].

