


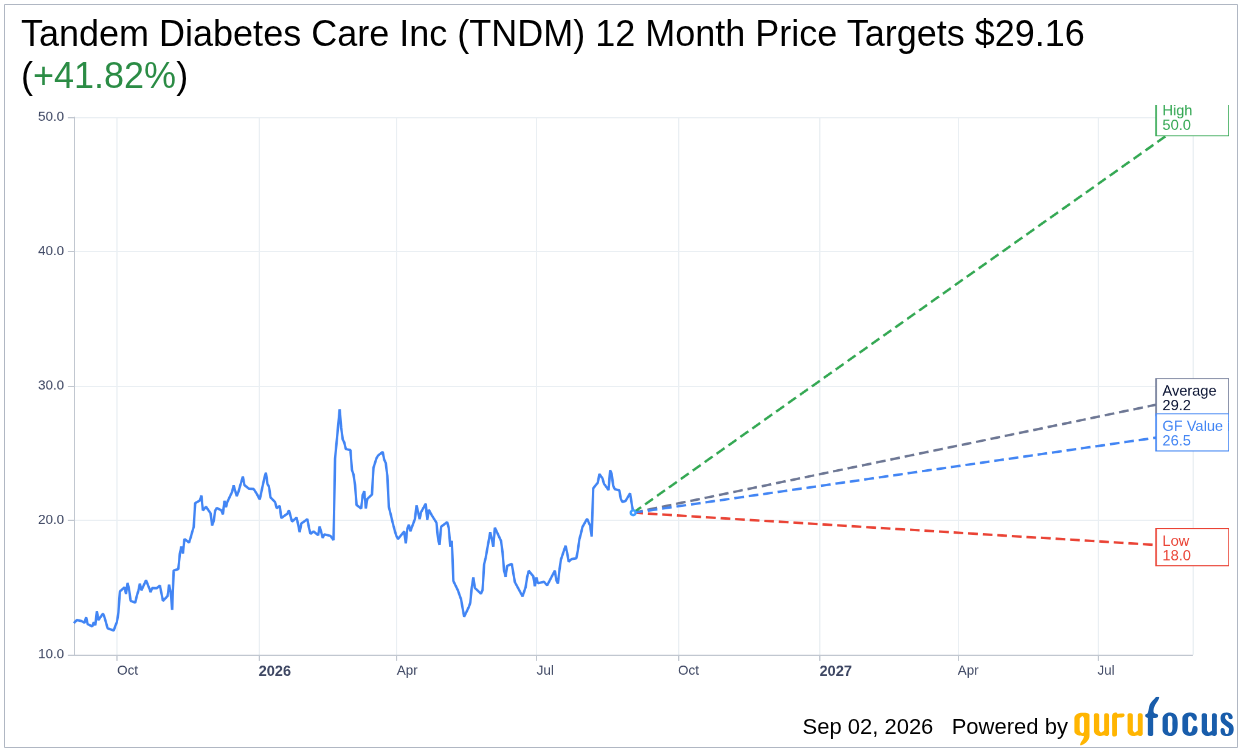
On September 02, 2026, Tandem Diabetes Care Inc TNDM shares fell 3.4% to a current price of $20.56, within a 52-week range of $11.46 to $29.65. The stock has seen a year-to-date decline of 6.5% but has surged 60.9% over the past year.
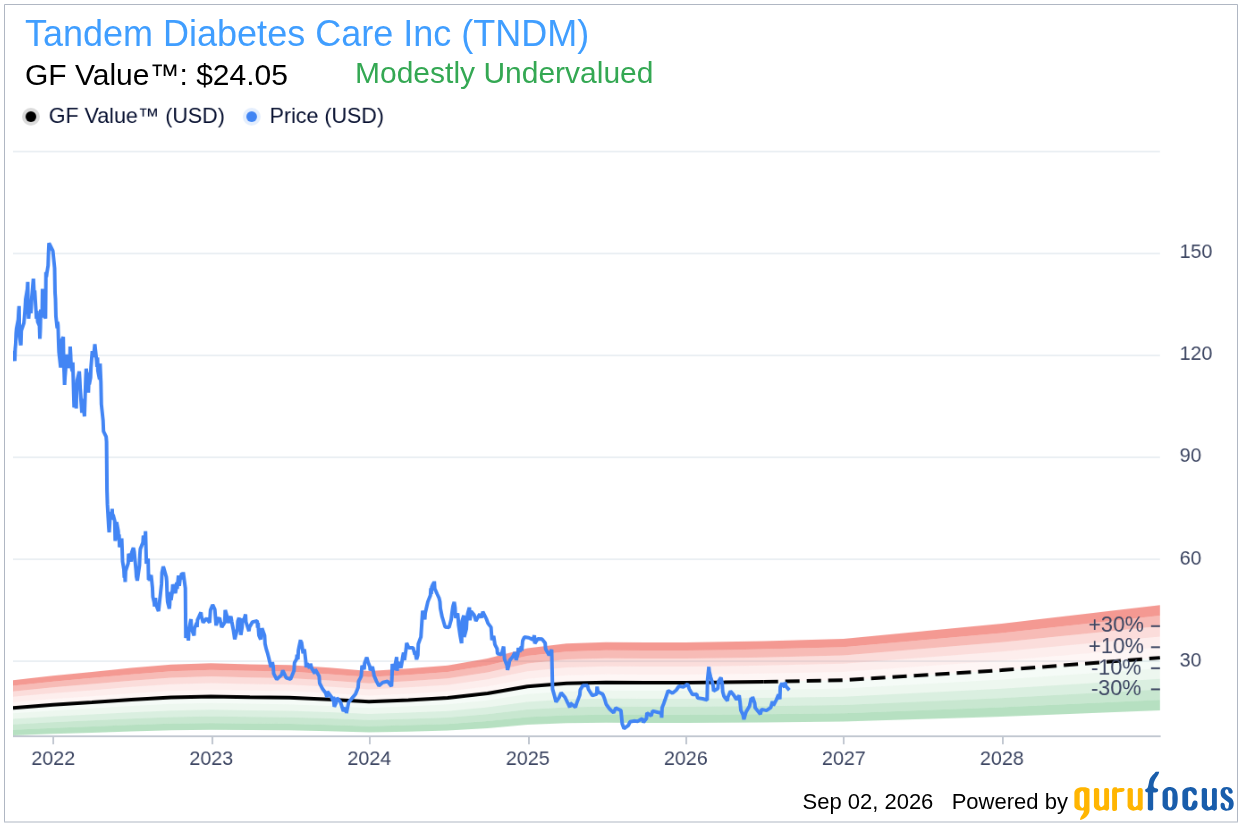
- GF Value™ verdict: Current price $20.56 vs GF Value $24.05, indicating a 14.5% undervaluation.
- GF Score™: 69/100, suggesting above-average performance.
- Most notable signal: No insider buying activity over the past 12 months, with insiders selling $0.0M.
Is TNDM Overvalued or Undervalued?
Tandem Diabetes Care Inc TNDM is currently trading at $20.56, which is below its GF Value™ estimate of $24.05. This represents a margin of safety of 14.5%, indicating that the stock may be undervalued. However, it is important to note that GF Value™ is GuruFocus' proprietary intrinsic-value estimate derived from historical trading multiples, past business growth, and future performance estimates. Given that TNDM is an unprofitable and cash-flow-negative company, the GF Value™ may not be a reliable indicator of fair value, but it does serve as a directional warning about extreme readings in valuation.
The GF Valuation label categorizes TNDM as modestly undervalued, suggesting that there is potential for price appreciation. However, caution is warranted due to the company's ongoing struggle with profitability, which may hinder its recovery in the long run.
How Does TNDM's Valuation Compare to Its History?
| Metric | Current | Historical |
|---|---|---|
| P/E (TTM) | 516.4x | 5-Year Median: 516.4x |
| Forward P/E | 141.8x | - |
Comparing TNDM's current P/E ratio of 516.4x to its 5-year median of the same value indicates that the stock is trading at a high valuation relative to its historical performance. The forward P/E of 141.8x also suggests that future earnings expectations are considerably elevated. This P/E analysis agrees with the GF Value™ verdict, highlighting concerns regarding the stock's valuation based on earnings, especially given its ongoing financial challenges.
What Does TNDM's GF Score™ Tell Us?
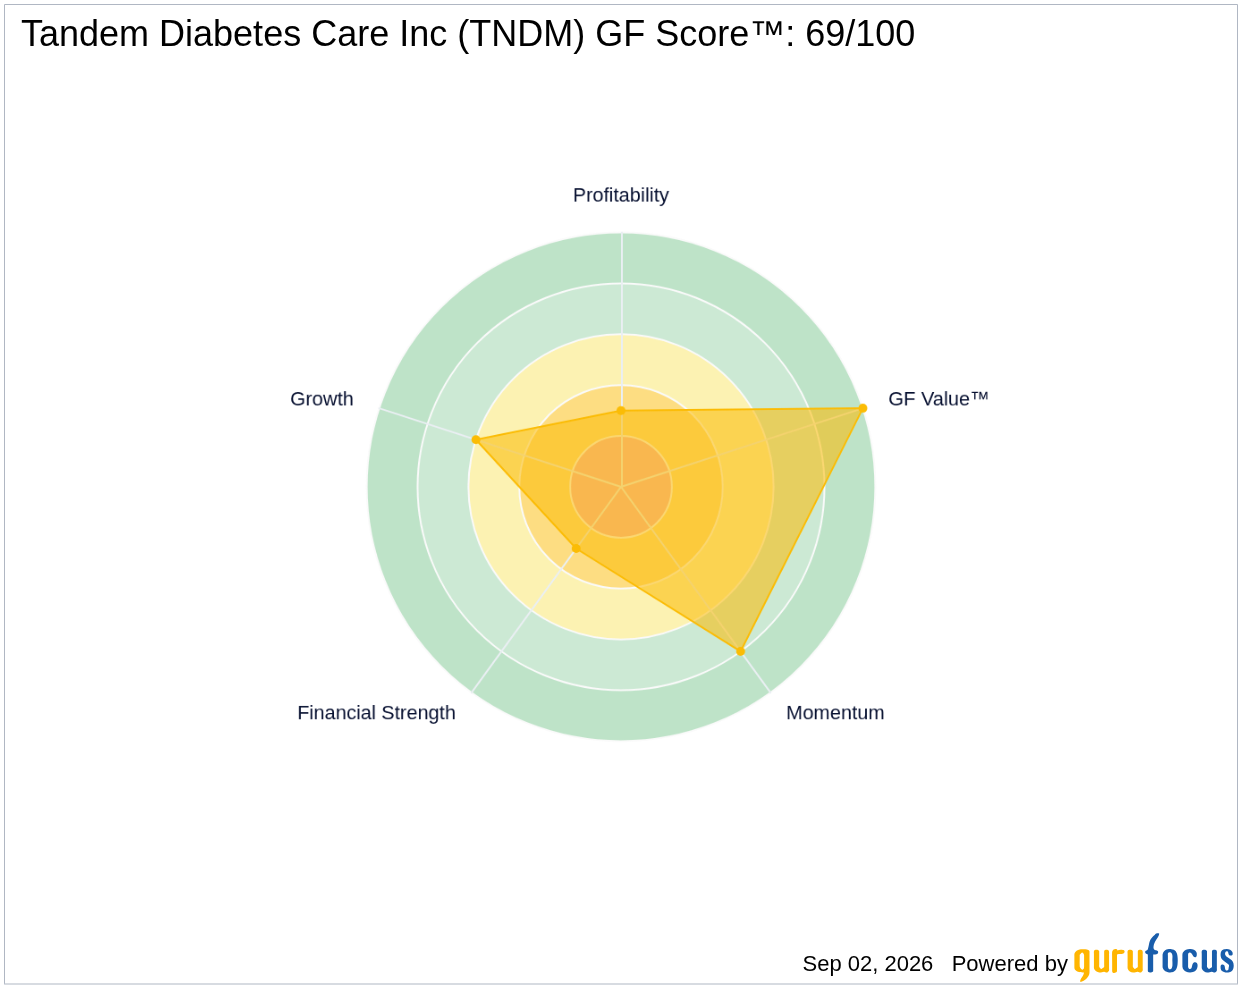
The GF Score™ is a composite measure that evaluates a company's financial strength, profitability, growth potential, valuation, and momentum. TNDM's score of 69/100 reflects above-average performance, with its strongest sub-rank in Valuation at 10/10, indicating that the stock is viewed favorably in terms of its current price relative to its intrinsic value. However, it struggles with Financial Strength and Profitability, both ranked at 3/10, suggesting that the company faces significant challenges in these areas.
| Metric | Rating |
|---|---|
| GF Score™ | 69 |
| Financial Strength | 3/10 |
| Profitability | 3/10 |
| Growth | 6/10 |
| Valuation | 10/10 |
| Momentum | 8/10 |
The overall scores suggest that while TNDM has a strong valuation signal, its weaknesses in financial strength and profitability are concerning. This indicates that while the stock may be attractive from a price standpoint, the underlying financial stability of the company remains a critical factor to consider.
What Are Gurus and Insiders Doing with TNDM?
Currently, five gurus hold shares of TNDM, with five increasing their positions and two trimming their holdings in recent quarters. This indicates a generally positive outlook among professional investors, although the lack of insider buying (with insiders selling $0.0M over the past year) raises questions about the confidence of company management in the stock's future performance.
The pattern of insider activity suggests that while guru interest may be growing, the absence of insider buying could indicate caution among those closest to the company. This duality in ownership signals presents a mixed narrative for prospective investors.
What This Means for Investors
In summary, TNDM appears to be undervalued based on its GF Value™ estimate, but this is tempered by the company's ongoing struggles with profitability and financial strength. The stock's valuation based on historical P/E ratios also raises concerns about its current market price. While the presence of guru interest is a positive signal, the lack of insider buying suggests caution. Investors should weigh these factors carefully when considering TNDM's potential for future growth.
For a more comprehensive analysis, visit the Tandem Diabetes Care Inc TNDM stock page, and check out the GF Value™ page for additional insights.
Frequently Asked Questions
What is TNDM's GF Score™?
TNDM has a GF Score™ of 69/100, which indicates above-average performance relative to its industry peers.
Is TNDM overvalued or undervalued?
According to the GF Value™ verdict, TNDM is currently undervalued by 14.5% based on its intrinsic value estimate.
What is TNDM's P/E ratio?
TNDM's P/E ratio is 516.4x, which is at its historical median, indicating that it is trading at a high valuation level compared to its past performance.
This stock alert was generated using automated technology and GuruFocus financial data to provide readers with timely and accurate market reporting. This content was reviewed by GuruFocus editorial team prior to publication. Please send any questions or comments about this story to [email protected].

