

 Overview
By now, investors should have recognized the poor value-add from Wall Street analysts. But what about the opposite? Namely, would stocks that sell-side analysts care about (cheer) less do better than the average? The answer should be a "yes," mainly due to the following:
- Under-covered stocks are less prone to price bubbles and volatility.
- These businesses deal less with the Street, leaving them more time to spend on business operations.
- Thanks to little (or no) analyst coverage, which is usually shortsighted, the management can focus on longer-term strategies.
"If we think long term, we can accomplish things that we couldn't otherwise accomplish."
- Jeff Bezos
Warren Buffett (Trades, Portfolio) is well known for spending almost zero time talking to analysts, while he estimates that 20% of the typical public CEO’s time is "wasted" on talking to Wall Street.
Of course, all the above three are conceptual, without any quantitative evidence yet. Therefore, it would be beneficial to run a backtest to find out whether under-coverage alpha exists among those under-covered stocks.
The strategy
As the first step, a ranking model is run against each stock in the S&P 500 universe to be assigned a "Urbem Under-Coverage Score" based on the following factors:
- The total number of analysts that give price targets.
- The total number of analysts that give the revenue estimate for the current and next years.
- The total number of analysts that give earnings-per-share estimates for the current and next years and quarters.
- The total number of analysts that forecast long-term earnings-per-share growth rates.
The "Urbem Under-Coverage Index" then incorporates, with equal weights, the top 50 stocks that are most neglected (highest ender-coverage scores) by Wall Street. The index rebalances itself every 52 weeks. The current holdings (as of May 10) in the index are listed below:
| Ticker | Weight | Return | Rank | Shares | Days Held |
| AES | 1.89% | 34.05% | 85.6 | 556 | 1970 |
| AIZ | 1.90% | 4.95% | 86.6 | 94 | 150 |
| ALLE | 2.05% | 54.70% | 88.7 | 97 | 1242 |
| AMG | 1.67% | -39.60% | 91 | 84 | 514 |
| ARE | 2.02% | 8.12% | 92.7 | 68 | 514 |
| ARNC | 1.99% | 9.19% | 87.5 | 426 | 150 |
| BR | 2.15% | 18.66% | 91.7 | 87 | 150 |
| BRK.B | 1.85% | 26.67% | 98.4 | 42 | 878 |
| CBRE | 2.15% | 116.76% | 90.3 | 209 | 2334 |
| CDNS | 2.92% | 57.24% | 90.5 | 201 | 514 |
| CINF | 2.15% | 115.95% | 95.7 | 107 | 4881 |
| CPRT | 2.56% | 40.90% | 85.7 | 183 | 150 |
| DVA | 1.61% | -10.96% | 87.3 | 146 | 150 |
| EXR | 1.91% | 5.02% | 86.8 | 87 | 150 |
| FLIR | 2.15% | 19.00% | 93.2 | 197 | 150 |
| GPC | 1.79% | -0.71% | 89.4 | 86 | 1606 |
| GRMN | 2.21% | 21.35% | 89.9 | 133 | 150 |
| GT | 1.41% | -22.13% | 92.2 | 390 | 150 |
| HII | 1.84% | 3.17% | 86 | 42 | 150 |
| HRB | 1.80% | 30.01% | 92 | 318 | 2334 |
| HRL | 1.61% | 6.14% | 88.6 | 193 | 1242 |
| IDXX | 2.34% | 53.41% | 93.5 | 45 | 514 |
| IPGP | 2.24% | 24.63% | 85.5 | 69 | 150 |
| IRM | 1.65% | 12.99% | 90.9 | 252 | 1242 |
| JKHY | 1.81% | 0.05% | 88.2 | 64 | 150 |
| KEYS | 2.68% | 47.29% | 92.9 | 147 | 150 |
| LEG | 1.80% | -9.60% | 95.7 | 224 | 1606 |
| LM | 2.28% | -2.00% | 87.6 | 319 | 1242 |
| LW | 1.70% | -6.80% | 96.1 | 117 | 150 |
| MSCI | 2.67% | 48.71% | 90.1 | 57 | 150 |
| NRG | 1.65% | 132.55% | 86.5 | 213 | 2334 |
| NWSA | 1.68% | -7.52% | 94.1 | 697 | 150 |
| PBCT | 1.91% | -12.58% | 91.6 | 532 | 878 |
| PBI | 1.40% | -54.20% | 96.6 | 1231 | 2698 |
| PSA | 1.88% | 4.03% | 86.2 | 40 | 150 |
| PWR | 2.21% | 21.67% | 86.9 | 279 | 150 |
| RE | 1.92% | 15.88% | 89.5 | 37 | 514 |
| RHI | 1.78% | -1.74% | 85.2 | 147 | 150 |
| RJF | 2.10% | -0.87% | 92.5 | 114 | 514 |
| RMD | 1.85% | 1.62% | 93.4 | 78 | 150 |
| ROL | 1.73% | -4.42% | 96.5 | 225 | 150 |
| RSG | 2.01% | 10.33% | 85.7 | 115 | 150 |
| SNA | 2.02% | 58.41% | 93.9 | 57 | 2334 |
| SNPS | 2.46% | 31.50% | 90.8 | 98 | 514 |
| TMK | 1.97% | 18.13% | 92.6 | 107 | 878 |
| TUP | 1.17% | -44.15% | 96.4 | 247 | 5606 |
| VAR | 2.05% | 47.86% | 88.1 | 72 | 878 |
| VRSN | 2.25% | 206.69% | 85.6 | 55 | 1970 |
| WHR | 2.01% | -17.51% | 89.6 | 71 | 1606 |
| WY | 1.84% | -17.50% | 88.3 | 340 | 878 |
Source: Portfolio123; data as of May 10, 2019.
From the list, it is not hard to spot some stocks that have stellar track records of generating tremendous values for shareholders (the most prominent one should be Berkshire Hathaway). There are also wonderful businesses earning high Urbem Quality Scores with superior return on invested capital and strong cash flow, such as Rollins, VeriSign, Jack Henry & Associates, and IDEXX Laboratories.
To break down in terms of sectors, the index currently overweights financial and industrial and underweights consumer staples and communication service (see below).

Source: Portfolio123; data as of May 10, 2019.
Backtest
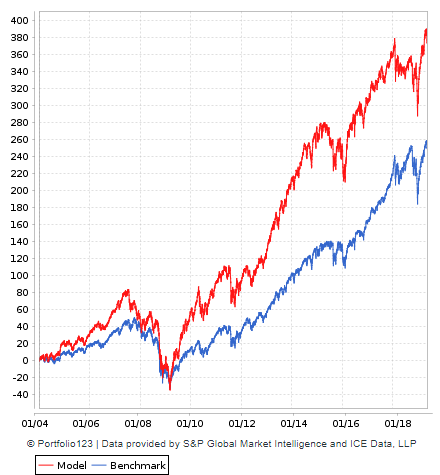
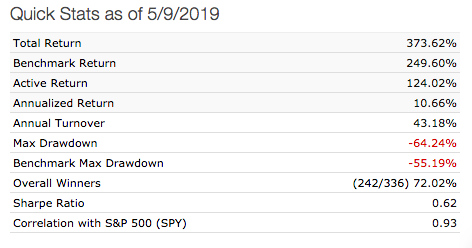
How would this under-coverage index have performed? I used Portfolio123 to calculate its historical returns compared to the S&P 500 SPY as the benchmark for the past 15 years.

Source: Portfolio123; data as of May 10, 2019.


Source: Portfolio123; data as of May 10, 2019.
Source: Portfolio123; data as of May 10, 2019.
As demonstrated above, the index has been delivering alpha, beating the benchmark by a wide margin so far. Please note that trading costs and management fees are not included in the performance calculation for the under-coverage Index.
Source: Portfolio123; data as of May 10, 2019.
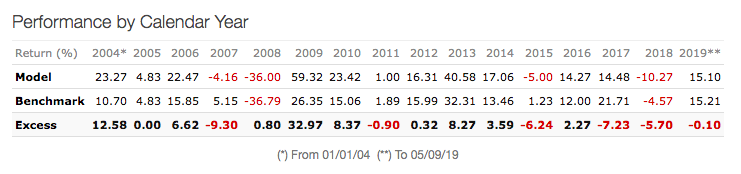
To break down by years (see above), only in the five out of the total 15 years did the under-coverage index fail to beat the market. However, the Index has been underperforming for the most recent two years. One explanation for this could be that in a soaring market, everything goes up in price, including "junk."
Limitation
Like all other quantitative methodologies, backtesting has its limitations. The main one, in our case (to test the alpha resulting from under-coverage), is due to it being backward-looking. A backtest purely considers the evidence from the past, but market dynamics could change in the future. For example, it could be the case that Wall Street analysts in aggregate could improve their analysis in the future or the case that corporates America on average would spend less effort on "co-promotion" on the Street for the short run and focus more on the long-term value creation for shareholders.
Summary
No one can predict the future, but the under-coverage alpha for the past 15 years did exist with regards to S&P 500, implying that large-cap equity investors could be better off picking stocks under-covered by Wall Street than chasing "hot" ones.
Read more here:
A Backtest Approach: Do Wall Street Analysts Add Value?
Secular Growth: The Ultimate Reinvestment Opportunity
The True Competitive Advantages of Berkshire Hathaway
Not a Premium Member of GuruFocus? Sign up for a free 7-day trial here.