


On August 13, 2026, BILL Holdings Inc BILL shares rose 5.4% to a current price of $51.31, reflecting a strong performance in the short term. Over the past month, the stock has surged by 19.7%, although it remains down 5.9% year-to-date. The 52-week trading range for BILL has been between $31.41 and $57.21.
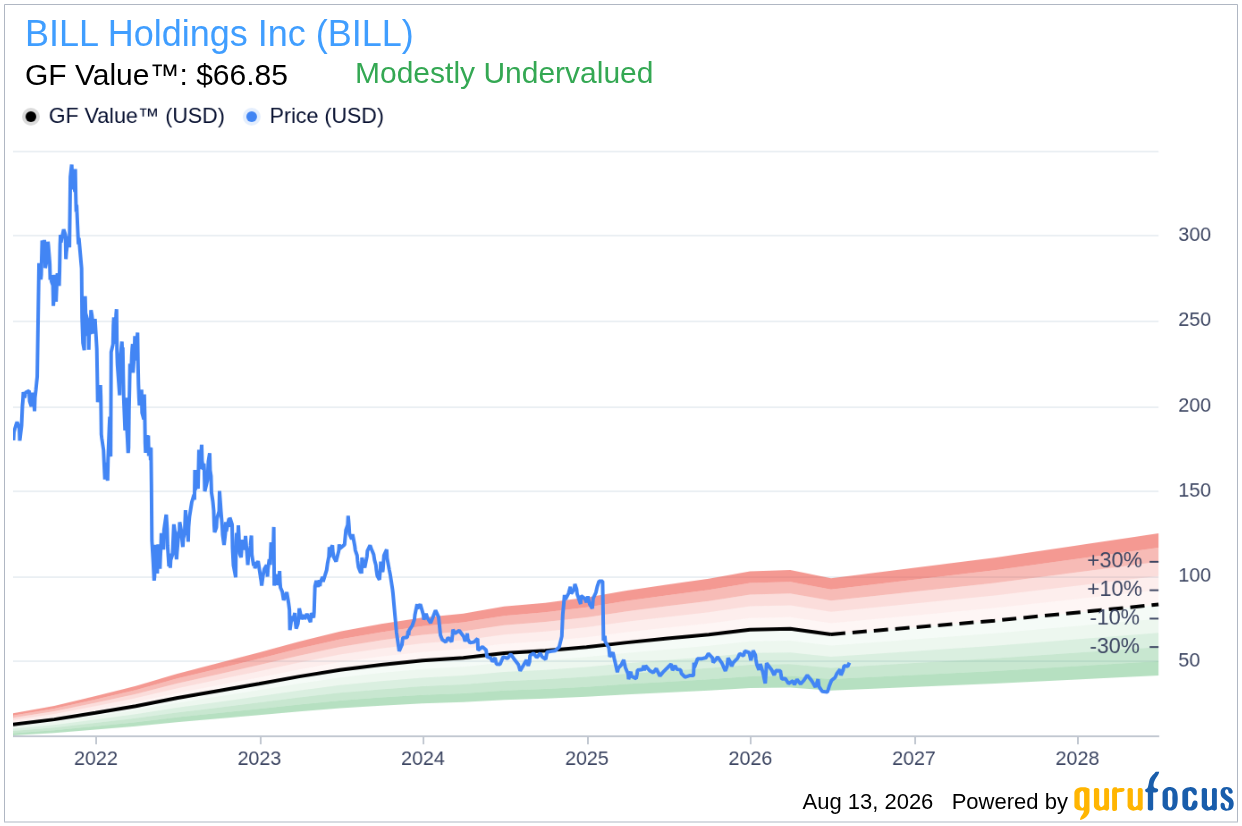
- GF Value™ verdict: Current price of $51.31 suggests a 23.2% upside to the estimated fair value of $66.85.
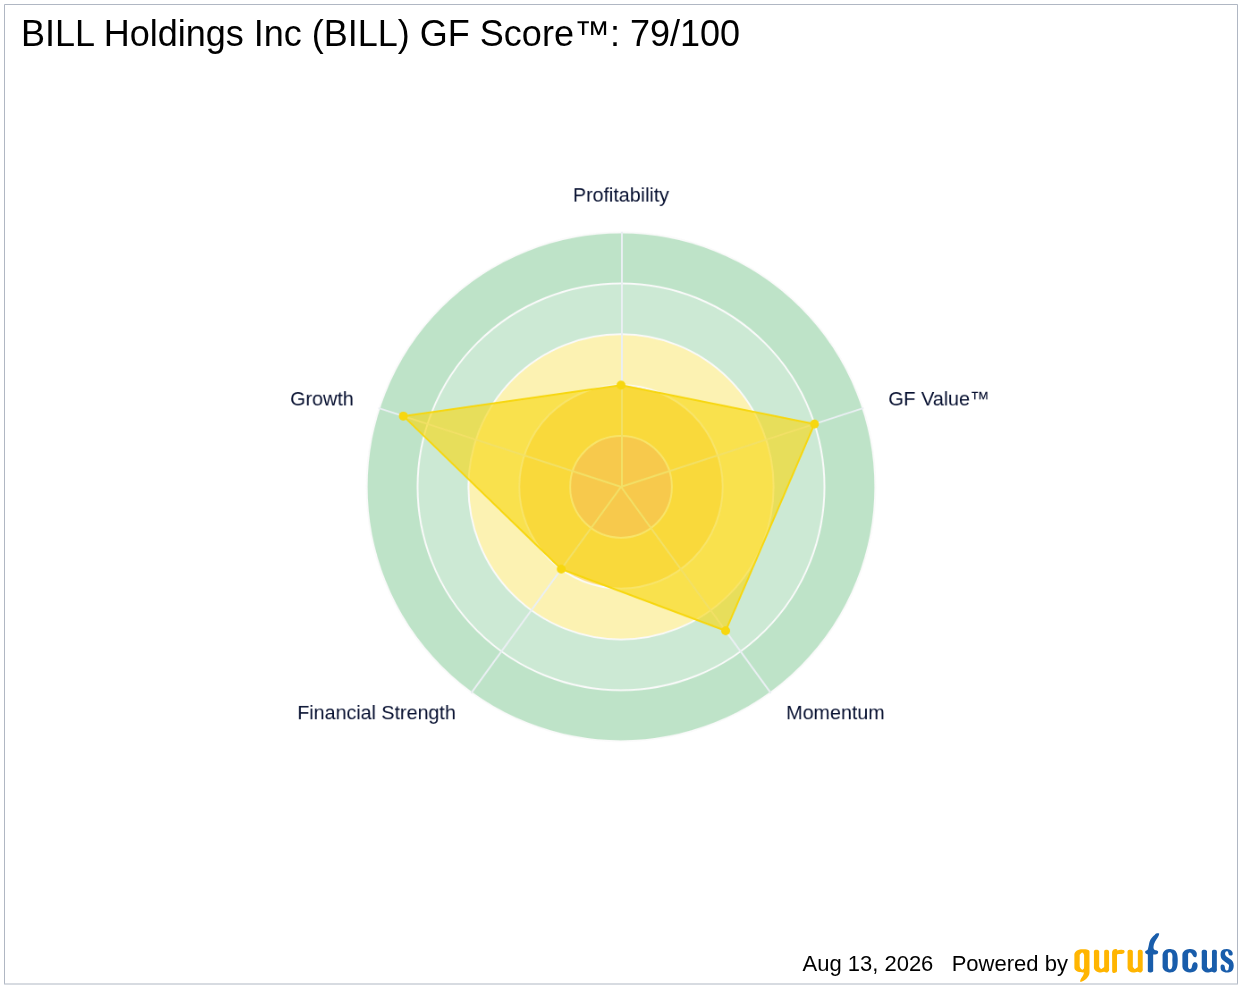
- GF Score™ of 79/100 indicates above-average overall performance.
- Notable signal: Insiders sold $1.2M worth of stock in the last three months, with no purchases.
Is BILL Overvalued or Undervalued?
According to the GF Value™, which is GuruFocus' proprietary intrinsic value estimate based on historical trading multiples, past business growth, and future performance estimates, BILL Holdings Inc is currently valued at $66.85. This suggests that the stock is 23.2% undervalued at its current price of $51.31. While this valuation indicates an opportunity for potential upside, it is essential to note that GF Value™ may not be entirely reliable for companies that are currently unprofitable or cash-flow negative, such as BILL. Thus, while the stock appears to be undervalued, investors should exercise caution and consider additional factors.
The GF Valuation label categorizes BILL as modestly undervalued, which aligns with the observed market performance. However, the inherent risks associated with investing in a company that is not yet generating profit may temper enthusiasm about this apparent opportunity.
How Does BILL's Valuation Compare to Its History?
| Metric | Current | Historical |
|---|---|---|
| Forward P/E | 15.3x | N/A |
Due to BILL's current status as a cash-flow-negative company, traditional earnings-based valuation methods like the P/E ratio may not provide the most accurate assessment. However, the forward P/E of 15.3x can be compared to its historical median, which stands at approximately 11.6x. This indicates that the stock is trading above its historical valuation metrics. This P/E analysis suggests a divergence from the GF Value™ verdict, further complicating the investment thesis.
What Does BILL's GF Score™ Tell Us?
The GF Score™ measures a company's overall performance based on multiple factors, including financial strength, profitability, growth, valuation, and momentum. BILL's GF Score™ of 79/100 reflects above-average potential, with notable strengths in growth and valuation, and weaknesses in financial strength and profitability.
| Metric | Rating |
|---|---|
| GF Score™ | 79 |
| Financial Strength | 4/10 |
| Profitability | 4/10 |
| Growth | 9/10 |
| Valuation | 8/10 |
| Momentum | 7/10 |
BILL's strongest area lies in growth, as indicated by its growth rank of 9/10, suggesting robust potential for future expansion. Conversely, the weakest areas are financial strength and profitability, both rated at 4/10, indicating challenges that could impact overall stability.
What Are Gurus and Insiders Doing with BILL?
Currently, five gurus hold positions in BILL, with three gurus adding to their stakes and four trimming their holdings in recent quarters. This mixed signal from guru activity suggests a cautious approach among institutional investors. Additionally, insider activity has shown a trend of selling, with insiders offloading $1.2 million worth of shares in the last three months and no reported buying. This pattern potentially raises red flags regarding the confidence of insiders in the company's future performance, contrasting with the bullish sentiment suggested by the stock's recent price increase.
What This Means for Investors
Overall, BILL Holdings Inc appears to be undervalued based on the GF Value™ assessment, which indicates a 23.2% upside potential. However, given the company's unprofitable status and the recent insider selling activity, potential investors should weigh these risks carefully before making investment decisions. For those interested in a deeper analysis, further insights can be found on the BILL Holdings Inc BILL stock page, and additional valuation information can be accessed through the GF Value™ page.
Frequently Asked Questions
What is BILL's GF Score™?
BILL's GF Score™ is 79/100, indicating above-average overall performance based on various factors.
Is BILL overvalued or undervalued?
BILL is currently undervalued, with the GF Value™ indicating a 23.2% upside potential to its estimated fair value.
What is BILL's P/E ratio?
BILL's forward P/E ratio is 15.3x, which is above its historical median of approximately 11.6x, signaling a potential overvaluation in comparison to its past performance.
This stock alert was generated using automated technology and GuruFocus financial data to provide readers with timely and accurate market reporting. This content was reviewed by GuruFocus editorial team prior to publication. Please send any questions or comments about this story to [email protected].

