
Introduction
The better informed the investor is, the better the investment decisions they can make. But being an informed investor can be a very arduous task, and some would even say that conducting research on common stocks is a real snoozer. Poring over mounds of financial data and trying to piece this information into meaningful and useful knowledge is not the average person's idea of a good time. Most people have better things to do with their time, yet recognize that making sound financial decisions is critical to their future.
It's logical to assume that the more you know about the companies you are investing in, the smarter you can be about making good choices. As previously stated, researching common stocks can be tedious, confusing and complex. But investing in common stocks without thoroughly understanding what you're buying or what you own can be foolish and dangerous at the same time. Therefore, most would be in agreement that a comprehensive and thorough research process before investing is prudent and necessary.
So if you're not willing to do the job yourself, then hiring a professional that you believe is competent and you can trust is a reasonable course of action. Even then, most investors would be more comfortable with their portfolios if they understood what they own and why they own it. Knowledge is power, and regarding investing, we believe an essential key to achieving financial success and controlling the amount of risk taken to achieve it. We share the same frustrations as other investors, which is why we developed our F.A.S.T. Graph™ tool (Fundamental Analyzer Software Tool).
This powerful research "tool to think with" was developed and designed to make the important task of researching a company easier and more efficient. This tool is not designed to be the end-all, as we believe that no such tool could even exist. Instead, this tool was designed to make the process of researching a company not only easier and more efficient for the average investor, but also to provide a clear and instant perspective of the fundamental value and financial strength of each company they own. Today's article is offered to illustrate how this process can make researching dividend stocks more effective, efficient and hopefully more enjoyable.
Important considerations before investing
Before investing in a common stock on behalf of a client or ourselves, it just seemed logical to possess key information that revealed the quality and the value of the business being considered. It made common sense to ask and answer some key questions about a business before laying the money down. For example, what kind of a track record has the company produced? What do their earnings and cash flows look like? How fast have they grown and how consistent has the growth been? This is all logical knowledge to have before investing.
Additionally, regarding their dividends, there are several questions that the discerning investor might ask: Are the dividends growing, and if so, at what rate and how consistently and for how long? Have they ever cut their dividend, and if they did, why? What about the payout ratio; is it reasonable and is it increasing or decreasing? Also the investor might ask; what has been the cumulative total amount of dividends paid over a given period of time, and what has been the nominal yield and yield on cost (growth yield) that the stock has delivered?
There are other questions regarding a company's fundamental values that a discerning investor should have answered. How has the market historically capitalized a given company's fundamental results? How do these valuations compare with other companies in other industries? And of course most importantly, how's the market valuing the business today; is it overpriced, underpriced or fairly priced? Although this information requires interpretation on the part of the researcher, clear answers can greatly facilitate the decision-making process.
Questions like those above, and many more, are easy to ask but difficult to answer. Although the information is readily available on public companies, it has to be pieced together from financial statements or other data sources. Once the information is gathered, then numerous calculations must be made in order to answer the proposed questions. But what if there was an easier way to get these important questions answered? The following look at three dividend paying stocks through the lens of our F.A.S.T. Graphs™ will hopefully bring some light to the subject.
Three dividend stocks
We are going to examine three dividend paying companies that, at first glance, appear to possess very similar fundamental attributes. Each of these companies are currently offering a similar dividend yield that is in excess of the yield available on a current 10-year treasury bond. Also, each of these companies are trading at similar current valuations as follows:
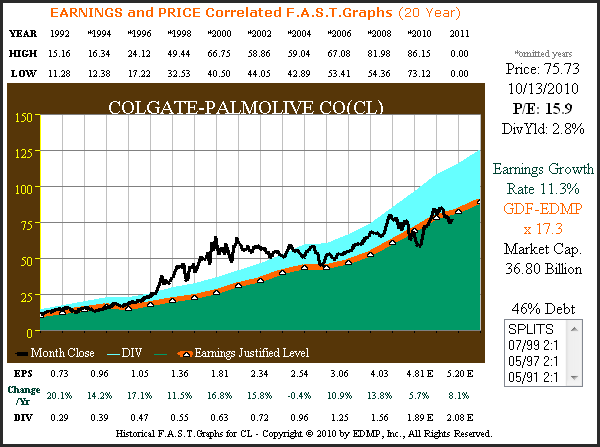
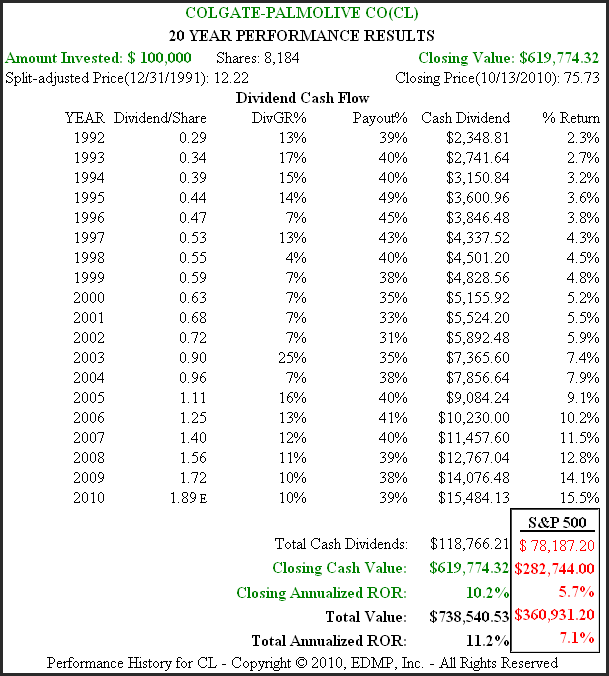
- Colgate-Palmolive Co. (CL) current PE ratio 15.9, dividend yield 2.8%
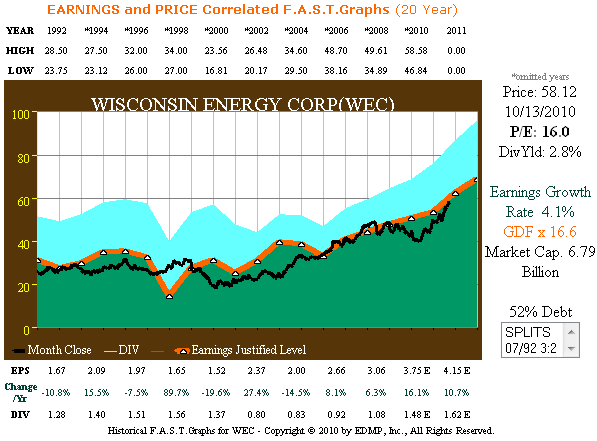
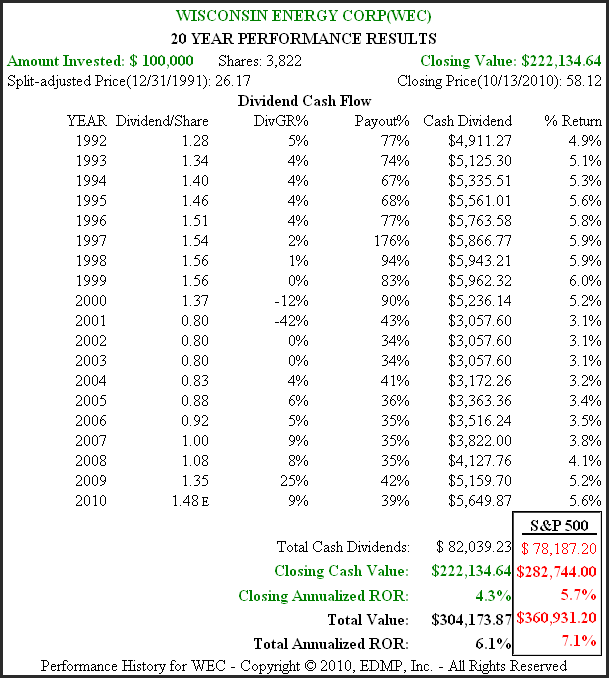
- Wisconsin Energy Corp. (WEC), current PE ratio 16, dividend yield 2.8%
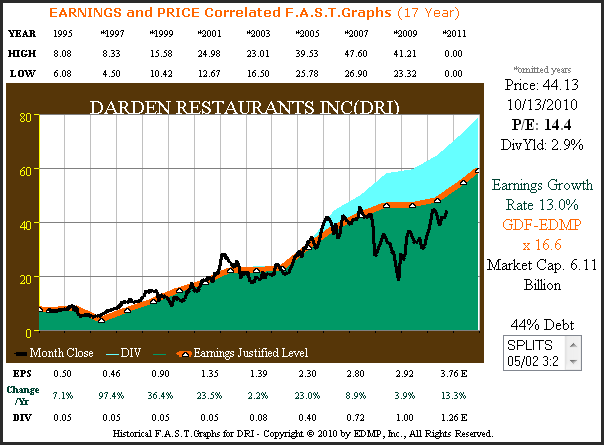
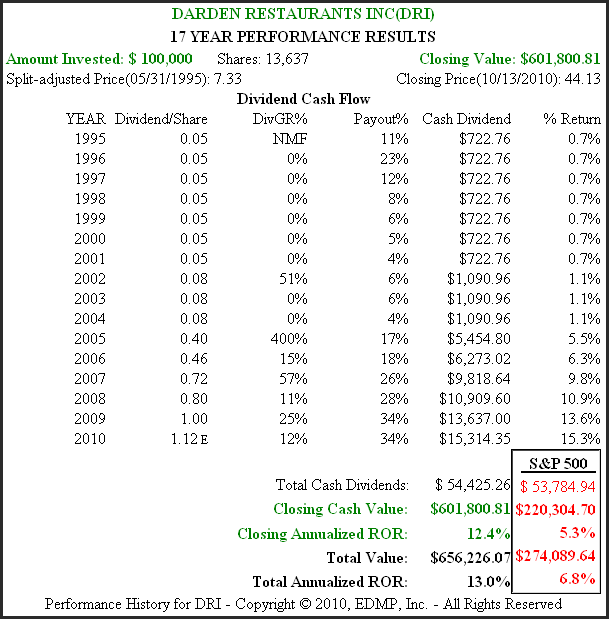
- Darden Restaurants Inc. (DRI), current PE ratio of 14.4 dividend yield 2.9%
From the information above, each of these companies appears to offer very similar (almost identical) dividend yields, and their current valuations are very similar. On the other hand, the information above offers us very little knowledge of the company's history and the fundamental records that they've achieved. There is much that can be learned from the past, if the important information is readily available.
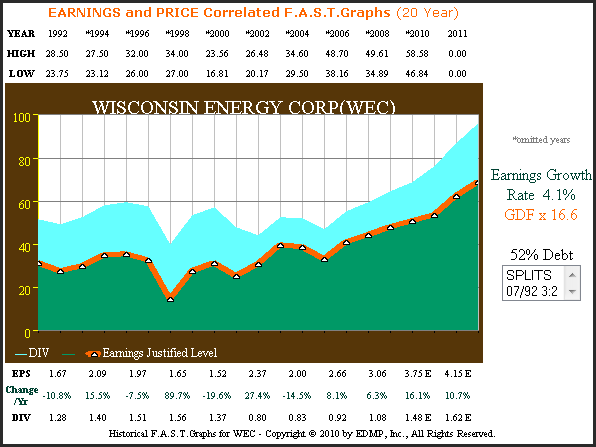
Therefore, let's look at each company from the perspective of historical earnings and dividends only. The three figures below visually depict each company’s earnings record (orange line with white triangles) since calendar year 1992.
CL 20yr. Earnings & Dividends Only

WEC 20yr. Earnings & Dividends Only
DRI 20yr. Earnings & Dividends Only
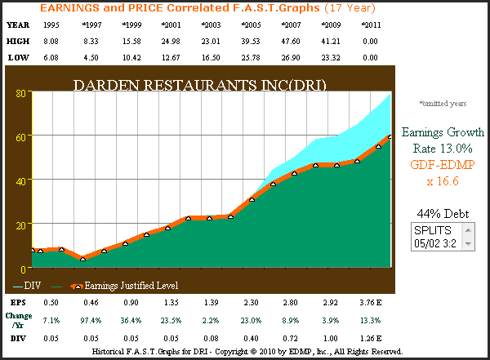

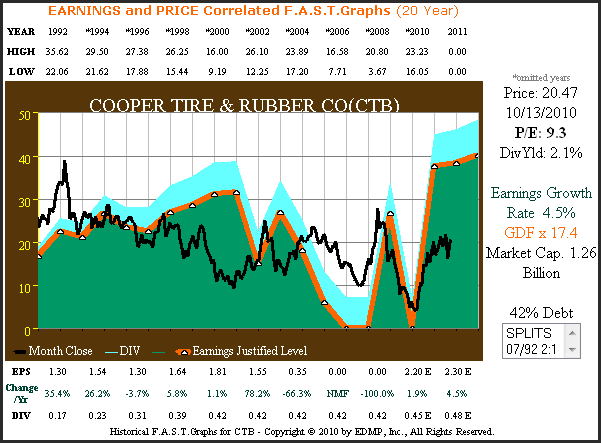
The growth rate of earnings achieved is listed to the right of the graph and the calculated True Worth™ price earnings ratio applied to the orange earnings justified valuation line is marked in orange numbers. The green shaded area represents earnings, and the blue shaded area represents dividends paid out of earnings. Therefore, at a glance, you can see how consistent and how fast earnings growth has been and the level of dividends that have been paid out of those earnings is also visible. Additional vital fundamental information can be gleaned from a quick review of each graph.
The next set of charts add monthly closing stock prices to the pictures. Now, again, in an instant, you receive answers to many of the important questions that were asked in the above paragraphs. First you can see how stock prices have tracked and correlated to earnings. You can also see how the market has historically valued each company, and determine whether or not the market is fairly valuing each respective company at present time.
CL 20yr. Earnings & Price Correlated F.A.S.T. Graphs
WEC 20yr. Earnings & Price Correlated F.A.S.T. Graphs
DRI 20yr. Earnings & Price Correlated F.A.S.T. Graphs
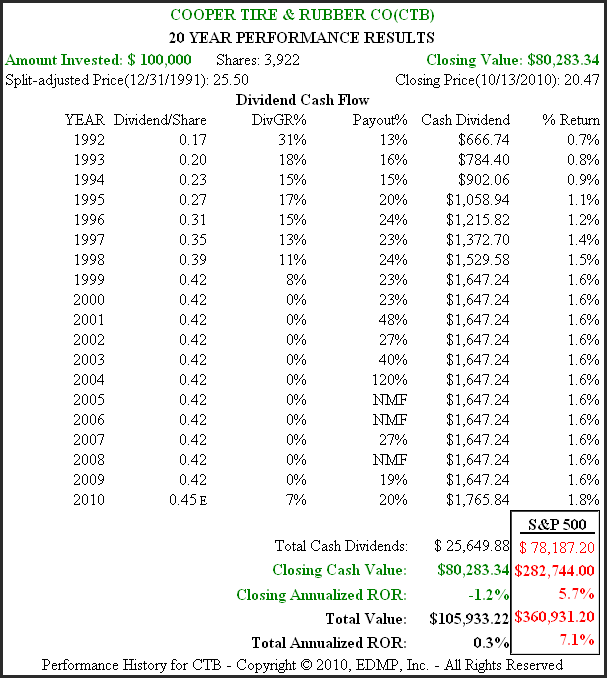
The next set of charts calculates the performance associated with each respective company’s earnings and price correlated graphs above. Here is where the real differences between each of these companies become readily apparent.
You will notice that since valuations were reasonably aligned at the beginning date of each graph and at the ending date, the total rate of return that each company generated for shareholders correlates very closely to their earnings growth. From the dividend cash flow table, the information answering the important questions regarding payout ratios, dividend growth, etc., is instantly provided. Most importantly, you're given a very clear perspective of how consistent and reliable the dividend streams of each company have been. Yield on cost is also easily ascertained and presented by the column below marked "% Return."
CL 20yr. Performance Results
WEC 20yr. Performance Results
DRI 20yr. Performance Results
The differences between each of the above companies is easily and quickly determinable by reviewing the essential “fundamentals at a glance” presented in pictorial form. You can see how important not only the growth rate of earnings is to both dividends and total return, but you can get a feel for how important consistency of earnings growth is. As an investor contemplating investing for dividends, the knowledge of what the company's historical results have looked like can be very helpful regarding making an informed investment decision.
Clearly, the graphs show that the faster the company’s earnings grow, the larger the total return and dividend income will be. Of course, this is only true if valuation at purchase is also correct. The simple point is that faster growing companies will generate better returns over time. So even when you find two companies with the same current dividend, a quick check of valuation and earnings growth potential will make a difference. Considerations regarding other fundamentals such as debt to equity ratios, etc. also need to be part of the decision making process.
A Stark Contrast
The following F.A.S.T. Graphs™ on Cooper Tire & Rubber Company (CTB) are offered to provide a stark contrast to the three examples above. Even though the dividend yield on Cooper Tire & Rubber of 2.1% is close to the three examples above, and the price earnings ratio of 9.3 is significantly lower than the other three, the difference in historical operating results and dividend records is striking. The Cooper Tire & Rubber (CTB) example is offered to vividly summarize the importance of the questions presented in this article.
CTB 20yr. Earnings & Price Correlated
CTB 20yr. Performance Results
Summary
Here's an interesting takeaway that we hope the above presentation illuminated. First of all, from the Colgate-Palmolive example it's clear that steady eddie is a very valuable attribute. Everything about Colgate's price-to-earnings correlated chart exudes consistency and quality. The historical growth rate of earnings is above-average and consistent. Colgate's track record of consistency and excellence is very appealing for investors that desire as much certainty of return as possible. Also, the value and importance of total return can be understood by reviewing Colgate's performance history.
Colgate-Palmolive also offers a very important lesson in valuation. If you would have purchased Colgate-Palmolive any time from 1997 – 2004 when the stock price was above the earnings justified valuation, your return would have been poor even though the company’s earnings growth remained strong and their dividend increased each year. Buying and holding a great company like Colgate-Palmolive only works if you don’t overpay for it.
Thanks to Colgate’s above-average earnings growth, their yield on cost is significantly higher than it is for the slower growing utility stock Wisconsin Energy Corp. Furthermore, total cumulative dividends paid, over this almost 2 decade time frame, was also greater than what was received from the slower growing utility. And importantly, the total return was not only greater than Wisconsin Energy Corp., it was also significantly better than the S&P 500 as well. Even though both of these companies look very similar based on current metrics, i.e., dividend yield and price earnings ratio, the historical record shows a huge difference between the two.
The third example, Darden Restaurant Group, presents an interesting contrast to Colgate and Wisconsin Energy. Of the three, it had the fastest growth rate but its dividend record is quite different. It's only been recently that their payout ratio has been high enough to consider it competitive regarding dividend income to the other two. Interestingly, although Darden Restaurant’s cumulative dividend has been the lowest of the three, due to its faster earnings growth, its total return has been the highest.
The Cooper Tire & Rubber example just shows how important it is to have a clear perspective of how well a company has historically performed on an operating basis. A current yield of 2.1% and a PE ratio under 10 looks very attractive at first glance. However, the prospective investor should consider how reliable and consistent the company's future might be based on an analysis of its historical past.
Conclusion
Not all dividends are the same, even when they appear to be. Having a clear perspective of a company’s past can offer important insights into the future. However, the past is not necessarily indicative of the future. Therefore, comprehensive research is always suggested. With that said, there is nevertheless a lot that can be learned from the past.
The opinions in this document are for informational and educational purposes only and should not be construed as a recommendation to buy or sell the stocks mentioned or to solicit transactions or clients. Past performance of the companies discussed may not continue and the companies may not achieve the earnings growth as predicted. The information in this document is believed to be accurate, but under no circumstances should a person act upon the information contained within. We do not recommend that anyone act upon any investment information without first consulting an investment advisor as to the suitability of such investments for his specific situation.
Disclosure: No positions at the time of writing.Also check out: (Free Trial)