
In Part 1 of this three-part series we focused on how to value slow and moderately fast growing businesses. In this article, Part 2, we will shift our focus on how to value faster growing companies. Our definition of a fast grower is one that has consistently compounded earnings at 15% per annum or better over extended periods of time (five years or longer). Furthermore, the more consistent the growth has been, the better it fits our definition of a pure growth stock. In Part 1, we also offered the idea that a PE ratio of 15 was appropriate for companies whose growth rates fell in the range of 0% to 15%. In other words, in addition to the fact that the PE ratio of 15 has been the average for indices like the S&P 500, there is also a logical and mathematical reality behind its validity. However, although a PE ratio of 15 was an appropriate valuation to pay for growth of up to 15%, we also pointed out that it did not necessarily indicate the rate of return investors should expect to receive.
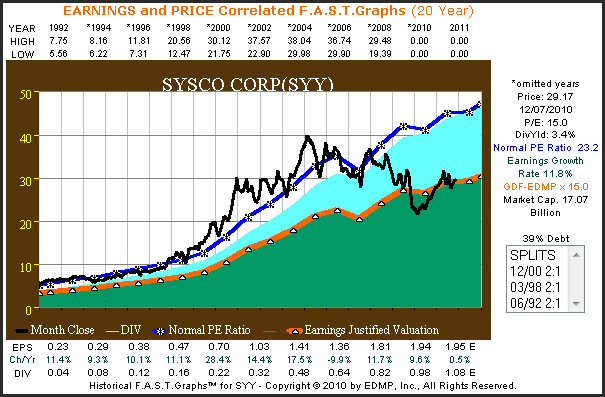
Also, the 15 PE ratio should not be looked at as an absolute, instead it should be viewed as a baseline barometer for fair value. In other words, the 15 PE is a good starting point guideline to ensure that you are not overpaying and taking too much risk. Consequently, anytime you come across a moderately growing company (5%-15%), whether a blue-chip or even a moderate to high dividend payer that is trading at a PE ratio above 15 then caution is called for. However, there are certain companies that will always command a premium valuation. Sysco (SYY, Financial) and Automatic Data Processing (ADP, Financial) are two examples as depicted in the long-term historical F.A.S.T. Graphs™ below.
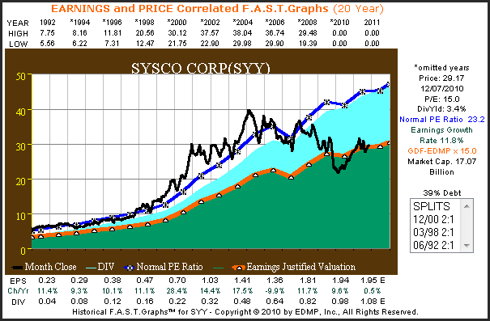
(SYY) 20 year earnings and price correlated F.A.S.T. Graphs™
The dark blue line on the Sysco Corp (SYY) F.A.S.T. Graphs™ represents a normal PE ratio for this quality company that is over 23. It is only been over the last couple of years where this company could have been purchased at a fair value PE ratio of 15. For the better part of the 16 years prior to 2007 an investor could not have purchased Sysco Corp. without paying up to buy it.
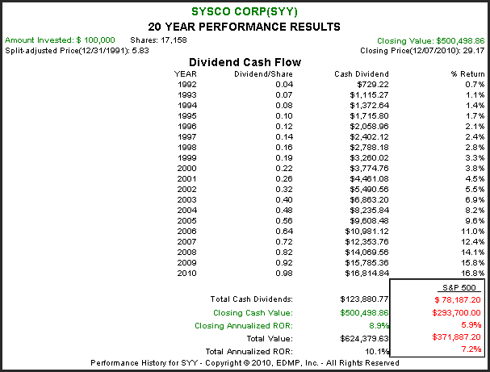
The reversion to the mean PE of 15 since 2007 does illustrate the risk associated with paying up. On the other hand, as the accompanying performance graph illustrates Sysco (SYY) outperformed the S&P 500 on both capital appreciation and total dividends. This is a testament to the power of strong earnings growth coupled with an increasing dividend that follows that earnings growth.
(SYY) 20 year performance results
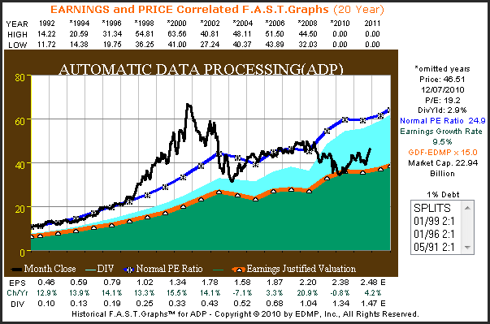
(ADP) 20 year price and earnings correlated F.A.S.T. Graphs™
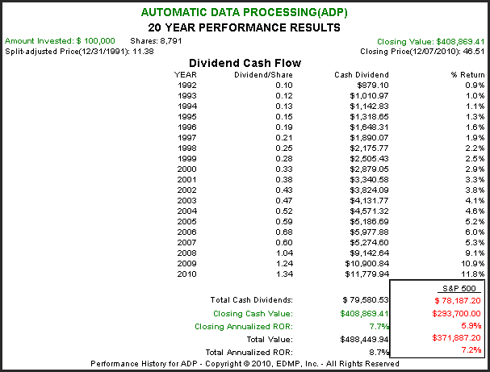
The exact same situation we saw with Sysco (SYY) applies to Automatic Data Processing (ADP) below. Even though the argument that 15 times earnings or a PE ratio of 15 would calculate to be fair value, prior to 2007, purchasing this quality company at a fair value PE ratio of 15 was never an available option. Once again, we discover that Automatic Data Processing (ADP) outperformed the S&P 500 notwithstanding the recent PE contraction.
(ADP) 20 year performance results
The moral of the story is that the primary determinant of what investors should expect as a reasonable rate of return is the company’s actual growth rate of earnings. To clarify, the assumption is that if a slow to moderate growing stock is bought at a reasonable PE ratio of 15, in the long run, the investor should expect to achieve capital appreciation that equates to its earnings growth rate. This of course assumes that the PE ratio at the end of the timeframe being measured is also close to 15. If the ending PE ratio is higher than 15, then the rate of return the investor achieves will be higher and vice versa. Also, total returns will additionally include dividends, if any.
Superstocks
Extensive research over many years has led us to conclude that a PE equal to earnings growth rate (PEG ratio) is more appropriate for companies that grow at faster rates. In Chapter 7 of his best-selling book One Up On Wall Street, the renowned investor Peter Lynch identified six general categories of common stocks: slow growers, stalwarts, fast growers, cyclicals, asset plays and turnarounds. Each of these categories were covered, one at a time, in previous articles starting with: When & Why to Buy and Sell a Stock (Part 1) This article will once again focus on the fast grower category.
This category of fast grower, Peter Lynch referred to as "superstocks" that deserve the most attention from investors. The reason they deserve the most attention, is because these are the stocks that will generate the highest total returns over the long run. Companies with these attributes are what Peter hunted for with he was seeking his "10 baggers", because he believed these were the most explosive stocks.
Utilizing our EDMP F.A.S.T. Graphs ™ tool we will demonstrate how reliably the PEG ratio formula applies to faster growing stocks through real world examples. Also, when dealing with this category of faster growing companies (15% or faster) an accompanying thesis states that a faster growing company is worth more than a slower grower. In other words, a company growing at 20% a year should logically command a PE ratio of 20, while a 25% grower should logically command a PE ratio of 25 and so on. This thesis applies up to a point where very high growth rates are unsustainable, usually growth rates of 30% or above. In other words there is a limit.
The three fast growers we examine immediately below will provide a look at a range of consistent historical earnings growth of 15% to 20%. In each case notice that the orange earnings justified valuation line will be plotted at a PE ratio that is equal to its achieved earnings growth rate. The growth rate number will be marked to the right of the graph in color-coordinated orange ink. The black monthly closing stock price is then overlaid on each graph.
Dividends, if any, are represented by the blue shaded area above the orange earnings justified valuation line. Dividends are paid out of the green shaded earnings area and are only stacked on top for visual perspective. One benefit this provides is the opportunity to see precisely when dividends are started. Keep in mind that companies that grow at this rate normally do not come with a high dividend yield. Performance graphs will accompany each earnings and price correlated historical F.A.S.T. Graphs™.
The main point of this analysis is to illustrate how closely the black monthly closing stock price line tracks the orange earnings justified valuation line. This validates a quote from Peter Lynch's runaway national bestseller One Up On Wall Street in Chapter 10, which was titled Earnings, Earnings, Earnings: "you can see the importance of earnings on any chart that has an earnings line running along side the stock price. On chart after chart the two lines will move in tandem, or if the stock price strays away from the earnings line, sooner or later it will come back to the earnings."
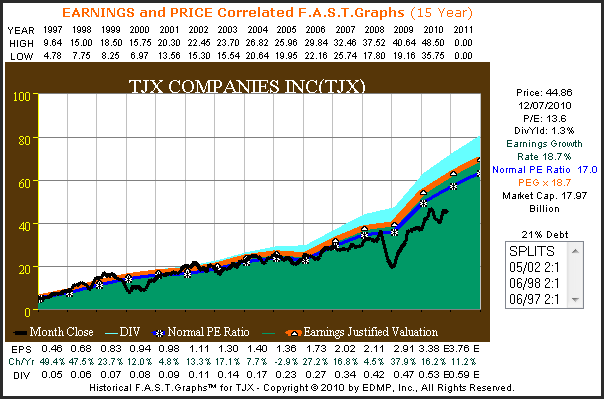
In each example below notice how shareholder returns closely correlate to the company’s achieved earnings growth rate. When earnings growth and shareholder returns are not perfectly correlated, it will be due to overvaluation or undervaluation at beginning and/or ending periods being measured. In other words, the black price line will be above or below the orange earnings justified valuation line. Examples of these discrepancies can be seen on the following three F.A.S.T. Graphs™.
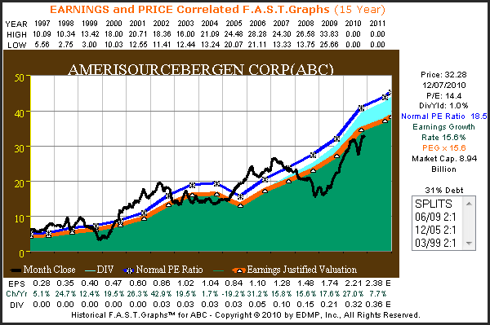
(ABC, Financial) 15 year earnings and price correlated F.A.S.T. Graphs™
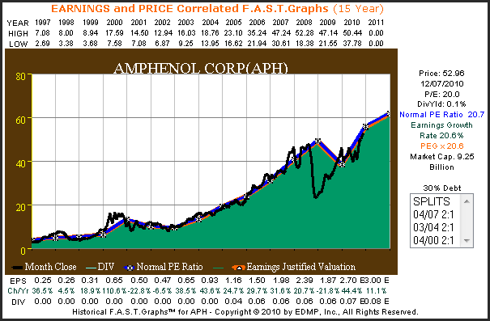
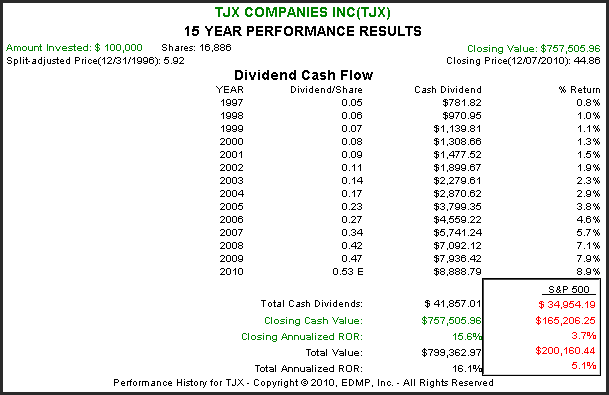
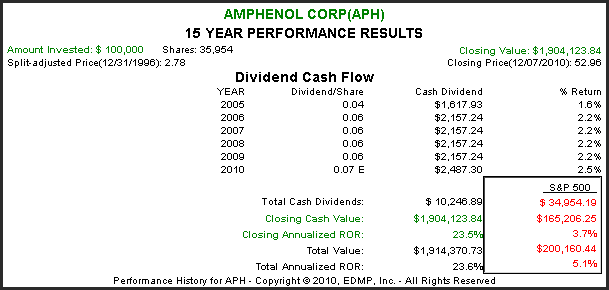
AmerisourceBergen Corp. (ABC) starts out a little overvalued and ends a little undervalued, which explains shareholder returns slightly less than its earnings growth rate. TJX Cos. Inc. starts out in value and ends undervalued, which also explains shareholder returns slightly less than its earnings growth rate. Amphenol Corp. (APH, Financial) starts out just slightly undervalued and ends at fair value, which explains shareholder returns exceeding its earnings growth rate. Most importantly, notice how price follows and correlates to the earnings line. Anytime price deviates over or under the orange line, it inevitably returns to fair value.
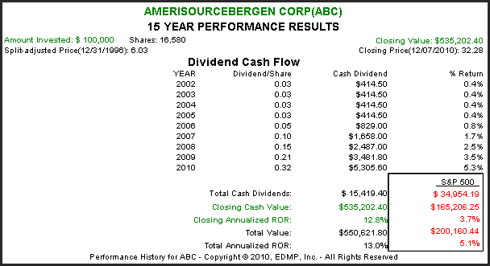
(ABC) 15 year performance results
(TJX, Financial) 15 year earnings and price correlated F.A.S.T. Graphs™

(TJX) 15 year performance results

(APH) 15 year earnings and price correlated F.A.S.T. Graphs™
(APH) 15 year performance results

Superfast “Superstocks”
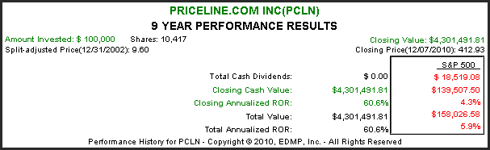
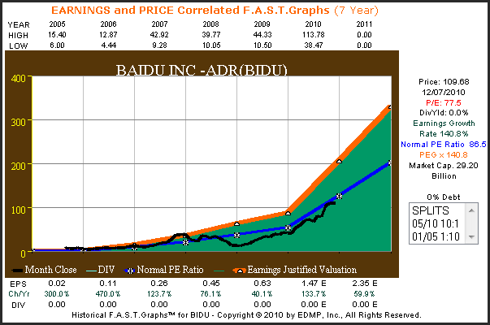
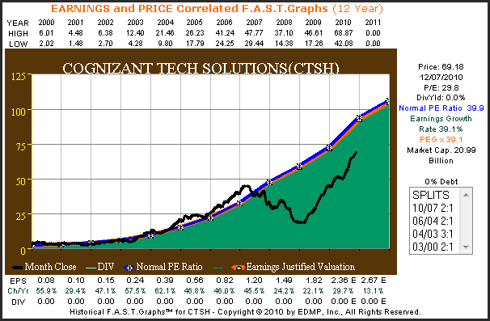
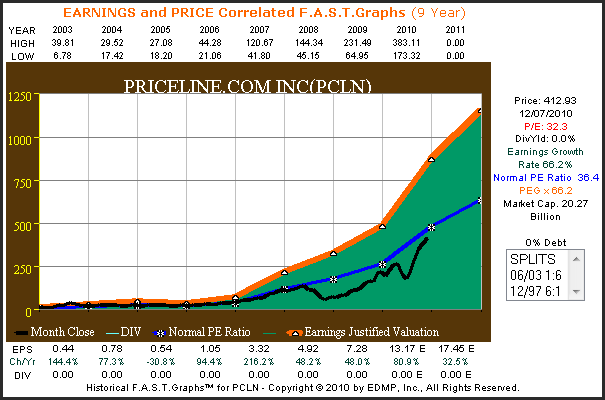
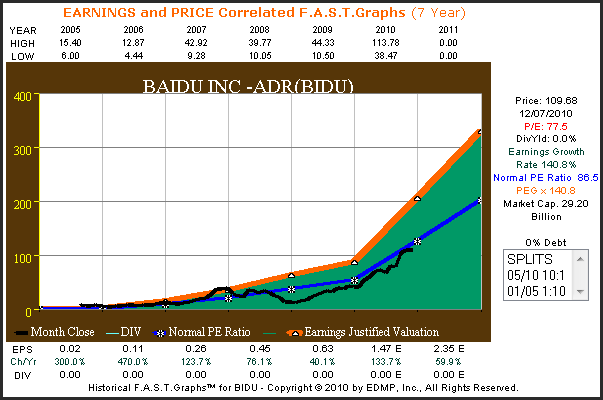
Our final three examples will review young but very fast-growing enterprises through the lens of our F.A.S.T. Graphs™ research tool. First we will look at Priceline.com Inc. (PCLN, Financial) which went public in 1999 but only generated earnings since 2003. Second, we will look at an ADR, Baidu Inc. (BIDU, Financial) the Chinese version of Google, based in Beijing, that went public in 2005. Our last example will look at Cognizant Technologies Inc. (CTSH, Financial) which was spun off from Dun & Bradstreet (DNB) in June of 1998.
Each of these three superfast "Superstocks" all grow earnings far in excess of 30% per annum and you will note that none of them pay a dividend. However, even without a dividend, shareholder returns are truly extraordinary. Additionally, these three examples illustrate that the PE equals growth rate (PEG ratio) formula does not perfectly apply; however, the general principles beneath them are still relevant.
Common sense generally keeps PE ratios below growth rates when growth is this high, because it is assumed that these extraordinary growth rates are not sustainable. The dark blue line represents the calculated historically normal PE ratio that the market has applied to each company. Its value is marked to the right of each graph in color-coded blue ink. Understand that anytime the black price line touches the blue line, the stock is trading at this indicated PE ratio. Therefore, visually and at a glance historically normal valuations can be observed.
(PCLN) 9 year earnings and price correlated F.A.S.T. Graphs™

(PCLN) 9 year performance results
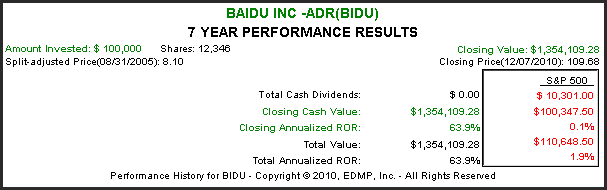
(BIDU) 7 year earnings and price correlated F.A.S.T. Graphs™
(BIDU) 7 year performance results

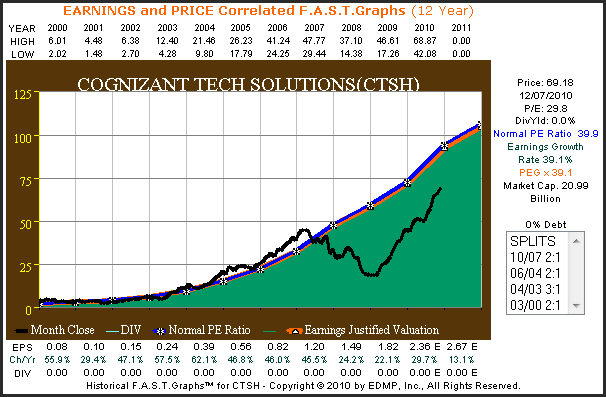
(CTSH) 12 year earnings and price correlated F.A.S.T. Graphs™
(CTSH) 12 year performance results

One important consideration that should be highlighted from the above F.A.S.T. Graphs™ on these superfast "Superstocks" is how little an effect the general health of the economy or the stock market had on their performance results. Shareholders were rewarded in direct proportion to each company’s operating performance. And, each of these companies’ operating performance was a function of their independent business plans and models.
Concluding remarks
From the insights provided by the F.A.S.T. Graphs™ above, the relationships between valuation and earnings growth rates should be clear. They also validate the notion that the concept of fair value or what we like to call True Worth™ should always be a consideration for investors. Valuation clearly matters, in fact, valuation matters a lot. When stocks are only viewed from the perspective of price alone, the principles behind valuation are easily missed or ignored. This can lead to very expensive investor mistakes.
Although the principles of valuation that the EDMP F.A.S.T. Graphs™ research tool is built upon are extremely relevant, they are not perfect. However, if used intelligently they can be a tremendous aid towards assisting investors in making the hard decisions of when to buy or sell a common stock. This is why we refer to them as "tools to think with.” The price-earnings relationships that this tool provides should be thought of as barometers or measuring sticks to think with. Their real value is in providing investors with an intelligent framework from which to make decisions upon.
As Warren Buffett has said: "the fact that people will be full of fear, greed or folly is predictable. The sequence is not predictable." The relevance of this statement implies accepting and recognizing periods of time when markets are behaving irrationally. There's no need to attempt to rationalize illogical behavior. What makes no sense, makes no sense. On the other hand, there is a great need to recognize crazy activity when it is occurring. Then and only then, can investors protect themselves from the dangers that exist when irrational exuberance or irrational pessimism rears its ugly head.
Our next and final installment in our long series on how to value a common stock will focus on how investors can avoid making obvious mistakes. There is no such thing as perfect market timing, but intelligent investing decisions can be made. All it takes is a little common sense and some basic understandings of what gives an investment its value. Investing is rarely a game of perfect, but there is no reason it can't be intelligent. When it is, appropriate results usually follow.
The opinions in this document are for informational and educational purposes only and should not be construed as a recommendation to buy or sell the stocks mentioned or to solicit transactions or clients. Past performance of the companies discussed may not continue and the companies may not achieve the earnings growth as predicted. The information in this document is believed to be accurate, but under no circumstances should a person act upon the information contained within. We do not recommend that anyone act upon any investment information without first consulting an investment advisor as to the suitability of such investments for his specific situation.
Also, the 15 PE ratio should not be looked at as an absolute, instead it should be viewed as a baseline barometer for fair value. In other words, the 15 PE is a good starting point guideline to ensure that you are not overpaying and taking too much risk. Consequently, anytime you come across a moderately growing company (5%-15%), whether a blue-chip or even a moderate to high dividend payer that is trading at a PE ratio above 15 then caution is called for. However, there are certain companies that will always command a premium valuation. Sysco (SYY, Financial) and Automatic Data Processing (ADP, Financial) are two examples as depicted in the long-term historical F.A.S.T. Graphs™ below.
(SYY) 20 year earnings and price correlated F.A.S.T. Graphs™
The dark blue line on the Sysco Corp (SYY) F.A.S.T. Graphs™ represents a normal PE ratio for this quality company that is over 23. It is only been over the last couple of years where this company could have been purchased at a fair value PE ratio of 15. For the better part of the 16 years prior to 2007 an investor could not have purchased Sysco Corp. without paying up to buy it.
The reversion to the mean PE of 15 since 2007 does illustrate the risk associated with paying up. On the other hand, as the accompanying performance graph illustrates Sysco (SYY) outperformed the S&P 500 on both capital appreciation and total dividends. This is a testament to the power of strong earnings growth coupled with an increasing dividend that follows that earnings growth.
(SYY) 20 year performance results

(ADP) 20 year price and earnings correlated F.A.S.T. Graphs™
The exact same situation we saw with Sysco (SYY) applies to Automatic Data Processing (ADP) below. Even though the argument that 15 times earnings or a PE ratio of 15 would calculate to be fair value, prior to 2007, purchasing this quality company at a fair value PE ratio of 15 was never an available option. Once again, we discover that Automatic Data Processing (ADP) outperformed the S&P 500 notwithstanding the recent PE contraction.

(ADP) 20 year performance results

The moral of the story is that the primary determinant of what investors should expect as a reasonable rate of return is the company’s actual growth rate of earnings. To clarify, the assumption is that if a slow to moderate growing stock is bought at a reasonable PE ratio of 15, in the long run, the investor should expect to achieve capital appreciation that equates to its earnings growth rate. This of course assumes that the PE ratio at the end of the timeframe being measured is also close to 15. If the ending PE ratio is higher than 15, then the rate of return the investor achieves will be higher and vice versa. Also, total returns will additionally include dividends, if any.
Superstocks
Extensive research over many years has led us to conclude that a PE equal to earnings growth rate (PEG ratio) is more appropriate for companies that grow at faster rates. In Chapter 7 of his best-selling book One Up On Wall Street, the renowned investor Peter Lynch identified six general categories of common stocks: slow growers, stalwarts, fast growers, cyclicals, asset plays and turnarounds. Each of these categories were covered, one at a time, in previous articles starting with: When & Why to Buy and Sell a Stock (Part 1) This article will once again focus on the fast grower category.
This category of fast grower, Peter Lynch referred to as "superstocks" that deserve the most attention from investors. The reason they deserve the most attention, is because these are the stocks that will generate the highest total returns over the long run. Companies with these attributes are what Peter hunted for with he was seeking his "10 baggers", because he believed these were the most explosive stocks.
Utilizing our EDMP F.A.S.T. Graphs ™ tool we will demonstrate how reliably the PEG ratio formula applies to faster growing stocks through real world examples. Also, when dealing with this category of faster growing companies (15% or faster) an accompanying thesis states that a faster growing company is worth more than a slower grower. In other words, a company growing at 20% a year should logically command a PE ratio of 20, while a 25% grower should logically command a PE ratio of 25 and so on. This thesis applies up to a point where very high growth rates are unsustainable, usually growth rates of 30% or above. In other words there is a limit.
The three fast growers we examine immediately below will provide a look at a range of consistent historical earnings growth of 15% to 20%. In each case notice that the orange earnings justified valuation line will be plotted at a PE ratio that is equal to its achieved earnings growth rate. The growth rate number will be marked to the right of the graph in color-coordinated orange ink. The black monthly closing stock price is then overlaid on each graph.
Dividends, if any, are represented by the blue shaded area above the orange earnings justified valuation line. Dividends are paid out of the green shaded earnings area and are only stacked on top for visual perspective. One benefit this provides is the opportunity to see precisely when dividends are started. Keep in mind that companies that grow at this rate normally do not come with a high dividend yield. Performance graphs will accompany each earnings and price correlated historical F.A.S.T. Graphs™.
The main point of this analysis is to illustrate how closely the black monthly closing stock price line tracks the orange earnings justified valuation line. This validates a quote from Peter Lynch's runaway national bestseller One Up On Wall Street in Chapter 10, which was titled Earnings, Earnings, Earnings: "you can see the importance of earnings on any chart that has an earnings line running along side the stock price. On chart after chart the two lines will move in tandem, or if the stock price strays away from the earnings line, sooner or later it will come back to the earnings."
In each example below notice how shareholder returns closely correlate to the company’s achieved earnings growth rate. When earnings growth and shareholder returns are not perfectly correlated, it will be due to overvaluation or undervaluation at beginning and/or ending periods being measured. In other words, the black price line will be above or below the orange earnings justified valuation line. Examples of these discrepancies can be seen on the following three F.A.S.T. Graphs™.
(ABC, Financial) 15 year earnings and price correlated F.A.S.T. Graphs™
AmerisourceBergen Corp. (ABC) starts out a little overvalued and ends a little undervalued, which explains shareholder returns slightly less than its earnings growth rate. TJX Cos. Inc. starts out in value and ends undervalued, which also explains shareholder returns slightly less than its earnings growth rate. Amphenol Corp. (APH, Financial) starts out just slightly undervalued and ends at fair value, which explains shareholder returns exceeding its earnings growth rate. Most importantly, notice how price follows and correlates to the earnings line. Anytime price deviates over or under the orange line, it inevitably returns to fair value.

(ABC) 15 year performance results

(TJX, Financial) 15 year earnings and price correlated F.A.S.T. Graphs™
(TJX) 15 year performance results
(APH) 15 year earnings and price correlated F.A.S.T. Graphs™

(APH) 15 year performance results
Superfast “Superstocks”
Our final three examples will review young but very fast-growing enterprises through the lens of our F.A.S.T. Graphs™ research tool. First we will look at Priceline.com Inc. (PCLN, Financial) which went public in 1999 but only generated earnings since 2003. Second, we will look at an ADR, Baidu Inc. (BIDU, Financial) the Chinese version of Google, based in Beijing, that went public in 2005. Our last example will look at Cognizant Technologies Inc. (CTSH, Financial) which was spun off from Dun & Bradstreet (DNB) in June of 1998.
Each of these three superfast "Superstocks" all grow earnings far in excess of 30% per annum and you will note that none of them pay a dividend. However, even without a dividend, shareholder returns are truly extraordinary. Additionally, these three examples illustrate that the PE equals growth rate (PEG ratio) formula does not perfectly apply; however, the general principles beneath them are still relevant.
Common sense generally keeps PE ratios below growth rates when growth is this high, because it is assumed that these extraordinary growth rates are not sustainable. The dark blue line represents the calculated historically normal PE ratio that the market has applied to each company. Its value is marked to the right of each graph in color-coded blue ink. Understand that anytime the black price line touches the blue line, the stock is trading at this indicated PE ratio. Therefore, visually and at a glance historically normal valuations can be observed.
(PCLN) 9 year earnings and price correlated F.A.S.T. Graphs™
(PCLN) 9 year performance results

(BIDU) 7 year earnings and price correlated F.A.S.T. Graphs™
(BIDU) 7 year performance results
(CTSH) 12 year earnings and price correlated F.A.S.T. Graphs™
(CTSH) 12 year performance results
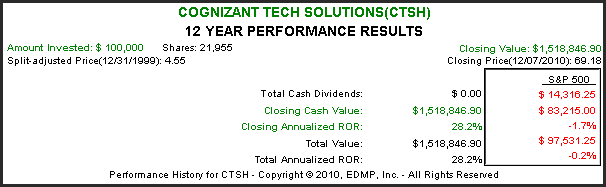
One important consideration that should be highlighted from the above F.A.S.T. Graphs™ on these superfast "Superstocks" is how little an effect the general health of the economy or the stock market had on their performance results. Shareholders were rewarded in direct proportion to each company’s operating performance. And, each of these companies’ operating performance was a function of their independent business plans and models.
Concluding remarks
From the insights provided by the F.A.S.T. Graphs™ above, the relationships between valuation and earnings growth rates should be clear. They also validate the notion that the concept of fair value or what we like to call True Worth™ should always be a consideration for investors. Valuation clearly matters, in fact, valuation matters a lot. When stocks are only viewed from the perspective of price alone, the principles behind valuation are easily missed or ignored. This can lead to very expensive investor mistakes.
Although the principles of valuation that the EDMP F.A.S.T. Graphs™ research tool is built upon are extremely relevant, they are not perfect. However, if used intelligently they can be a tremendous aid towards assisting investors in making the hard decisions of when to buy or sell a common stock. This is why we refer to them as "tools to think with.” The price-earnings relationships that this tool provides should be thought of as barometers or measuring sticks to think with. Their real value is in providing investors with an intelligent framework from which to make decisions upon.
As Warren Buffett has said: "the fact that people will be full of fear, greed or folly is predictable. The sequence is not predictable." The relevance of this statement implies accepting and recognizing periods of time when markets are behaving irrationally. There's no need to attempt to rationalize illogical behavior. What makes no sense, makes no sense. On the other hand, there is a great need to recognize crazy activity when it is occurring. Then and only then, can investors protect themselves from the dangers that exist when irrational exuberance or irrational pessimism rears its ugly head.
Our next and final installment in our long series on how to value a common stock will focus on how investors can avoid making obvious mistakes. There is no such thing as perfect market timing, but intelligent investing decisions can be made. All it takes is a little common sense and some basic understandings of what gives an investment its value. Investing is rarely a game of perfect, but there is no reason it can't be intelligent. When it is, appropriate results usually follow.
The opinions in this document are for informational and educational purposes only and should not be construed as a recommendation to buy or sell the stocks mentioned or to solicit transactions or clients. Past performance of the companies discussed may not continue and the companies may not achieve the earnings growth as predicted. The information in this document is believed to be accurate, but under no circumstances should a person act upon the information contained within. We do not recommend that anyone act upon any investment information without first consulting an investment advisor as to the suitability of such investments for his specific situation.