
T. Rowe Price Group, Inc. (TROW, Financial) is a publicly owned asset management holding company. The firm primarily provides its services to individual and institutional investors, retirement plans, and financial intermediaries. The company is a dividend achiever which has increased distributions for 24 years in a row. The most recent dividend increase was in February, when the Board of Directors approved a 14.80% increase to 31 cents/share. The major competitors of T. Rowe Price Group include Blackrock Inc (BLK, Financial), Eaton Vance (EV, Financial) and Franklin Resources (BEN, Financial).
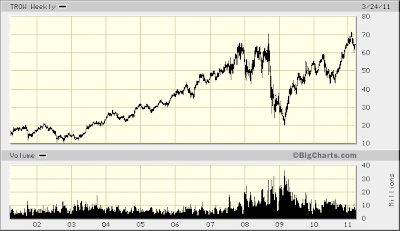
Over the past decade this dividend stock has delivered an annualized total return of 13.90% to its loyal shareholders.
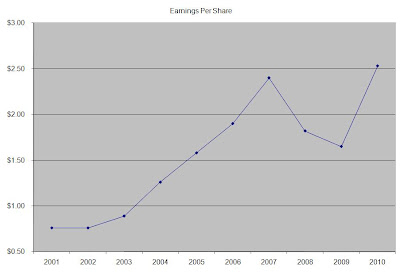
The company has managed to deliver an impressive increase in EPS of 14.30% per year since 2001. Analysts expect T.Rowe Price Group to earn $3.23 per share in 2011 and $3.81 per share in 2012. This would be a nice increase from the $2.53/share the company earned in 2010.
Long term growth in earnings is dependent on several factors including attracting new assets under management, maintaining management fees on assets under management and the overall performance of financial markets. When the stock market increases in value, assets under management generally tend to increase as well. This brings in more revenues to companies like T.Rowe Price. Mutual Funds that also perform at least as well as the average, would likely keep investors holding on to their fund shares. The costs of running a mutual fund do not increase proportionately with the amount of money under management. As a result higher amounts of assets under management provides the investment adviser with a sufficient scale that would allow them to charge lower management fees than peers, which could potentially entice investors to switch over, without hurting profitability.
T.Rowe Price is strategically positioned to make money from the wave of Baby Boomers that will be retiring between 2008 and 2024. Given the widespread appeal of such plans as the 401 (K) or IRA’s, I expect a larger portion of the population in the US to keep saving for retirement. As a result, companies like T.Rowe Price could only benefit from that trend as well. Two thirds of the company’s assets under management are in retirement accounts, which generally tend to have a lower turnover rate.
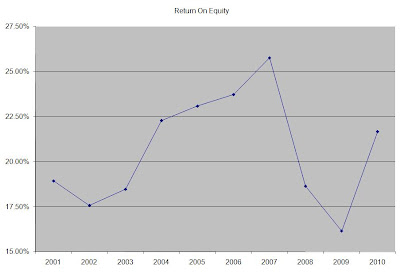
The trend in return on assets has closely followed the annual fluctuations in the stock markets. Rather than focus on absolute values for this indicator, I generally want to see at least a stable return on equity over time.
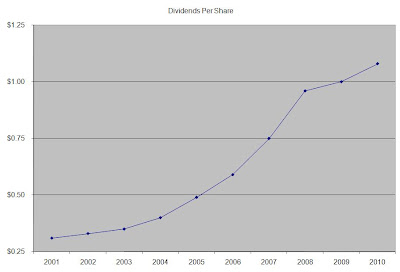
The annual dividend payment has increased by 14.90% per year since 2001, which is lower than the growth in EPS. A 15% growth in distributions translates into the dividend payment doubling every five years. If we look at historical data, going as far back as 1987, we see that T. Rowe Price has actually managed to double its dividend every four years on average.
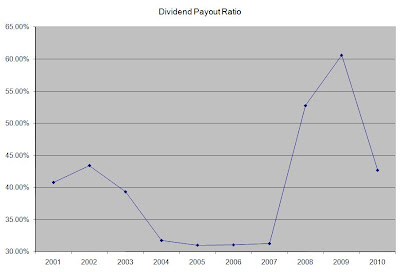
Over the past decade the dividend payout ratio has been characterized by short spikes during bear markets of 2001-2003 and 2007-2009.. A lower payout is always a plus, since it leaves room for consistent dividend growth minimizing the impact of short-term fluctuations in earnings.
Currently T.Rowe Price is trading at 25.50 times earnings, yields 1.90% and has a sustainable dividend payout. The stock would meet my entry criteria if it fell under $50.
Full Disclosure: None
Over the past decade this dividend stock has delivered an annualized total return of 13.90% to its loyal shareholders.

The company has managed to deliver an impressive increase in EPS of 14.30% per year since 2001. Analysts expect T.Rowe Price Group to earn $3.23 per share in 2011 and $3.81 per share in 2012. This would be a nice increase from the $2.53/share the company earned in 2010.
Long term growth in earnings is dependent on several factors including attracting new assets under management, maintaining management fees on assets under management and the overall performance of financial markets. When the stock market increases in value, assets under management generally tend to increase as well. This brings in more revenues to companies like T.Rowe Price. Mutual Funds that also perform at least as well as the average, would likely keep investors holding on to their fund shares. The costs of running a mutual fund do not increase proportionately with the amount of money under management. As a result higher amounts of assets under management provides the investment adviser with a sufficient scale that would allow them to charge lower management fees than peers, which could potentially entice investors to switch over, without hurting profitability.
T.Rowe Price is strategically positioned to make money from the wave of Baby Boomers that will be retiring between 2008 and 2024. Given the widespread appeal of such plans as the 401 (K) or IRA’s, I expect a larger portion of the population in the US to keep saving for retirement. As a result, companies like T.Rowe Price could only benefit from that trend as well. Two thirds of the company’s assets under management are in retirement accounts, which generally tend to have a lower turnover rate.

The trend in return on assets has closely followed the annual fluctuations in the stock markets. Rather than focus on absolute values for this indicator, I generally want to see at least a stable return on equity over time.

The annual dividend payment has increased by 14.90% per year since 2001, which is lower than the growth in EPS. A 15% growth in distributions translates into the dividend payment doubling every five years. If we look at historical data, going as far back as 1987, we see that T. Rowe Price has actually managed to double its dividend every four years on average.

Over the past decade the dividend payout ratio has been characterized by short spikes during bear markets of 2001-2003 and 2007-2009.. A lower payout is always a plus, since it leaves room for consistent dividend growth minimizing the impact of short-term fluctuations in earnings.

Currently T.Rowe Price is trading at 25.50 times earnings, yields 1.90% and has a sustainable dividend payout. The stock would meet my entry criteria if it fell under $50.
Full Disclosure: None