

Executive Summary
First quarter 2021 emerging debt returns reflected the continued improvement of global economic and market conditions. The external debt EMBIG-D index was down -4.5%; though credit spreads widened minimally, index losses were driven by the upward trend in U.S. Treasury yields. The local debt GBI-EMGD index was also down, by -6.7%, as both currency returns (-3.0%) and local rates (-3.7%) produced losses during the quarter.
As we enter the second quarter of 2021, due to the continued rally, our valuation metrics for emerging external debt are less compelling than they were at the beginning of the quarter. However, we view much of this change as being a result of spreads normalizing as transaction and liquidity stresses have been reduced. Valuations continue to remain within the historical range that we consider attractive, and the fundamentals of a majority of the emerging market (EM) asset class remain supportive of positive valuations going forward. While emerging currencies are currently within the neutral range of fair value, they also remain attractive relative to the past 10-year average. It is also worth noting that EM currencies remain cheap from a fundamental perspective thanks to continued strong improvements in balance of payments across EM. In addition, the sell-off of EM interest rates in Q1 made local rates more attractive at the end of the quarter. Real interest rate differentials between emerging and developed markets (DM) have widened notably as EM rates sold off more than DM rates.
In this piece, we update our valuation charts and commentary, with additional detail on our methodology available upon request.1
External Debt Valuation
The EMBIG-D benchmark spread widened marginally in Q1, by only 3 bps, ending the quarter at 354 bps. As seen in Exhibit 1, the multiple of the benchmark's credit spread to the spread that would be required to compensate for credit losses fell over the course of the quarter. That multiple stood at 2.5x on March 31, 2021, down slightly from 2.6x on December 31, 2020. Based on historical experience, this multiple of 2.5x is inching toward the level that we would deem unattractive, and significantly less attractive than what prevailed at the end of March 2020 (7.2x), right around the peak of last year's sell-off.
EXHIBIT 1: LONG-TERM VIEW OF THE "FAIR MARKET MULTIPLE" FOR EMERGING EXTERNAL DEBT
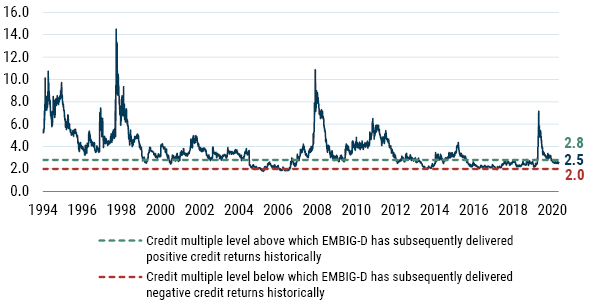
As of 3/31/2021 | Source: GMO calculations based on Bloomberg and J.P. Morgan data
As spreads experienced only a small widening, the credit multiple was essentially unchanged over the quarter, and the multiple's denominator – the fair value spread or expected credit loss – also moved marginally, rising by only 3 bps to 139 bps at the end of March. Regular readers will recall that this fair value spread is a function of the weighted-average credit rating of the benchmark, along with historical sovereign credit transition data and an assumption about recovery values given default. In terms of the first quarter, the fair value spread was influenced by a handful of downgrades including Ethiopia (B to B- in February), Belize (CCC+ to CC in February), Kenya (B+ to B in March), and Chile (A+ to A in March). Additionally, while Georgia and Bolivia were placed on Negative Outlook, Slovakia and Azerbaijan were placed on Stable Outlook.
The preceding was a discussion of the level of spreads, or credit cushion. From a total return standpoint, the level and changes of the underlying risk-free rate also matters. U.S. Treasury yields rose sharply during the quarter, with the 10-year yield rising by 83 bps and having a negative impact on benchmark returns. We measure the "cushion" (which we proxy as the slope of the forward curve) in Treasuries by the slope of the forward curve of the 10-year swap rate, depicted by the light-font lines in Exhibit 2. As U.S. Treasury yields trended upward, the slope of the 10-year forward curve steepened, from 47 bps to 69 bps as of the end of March (in fact, the entire curve shifted higher by about 80-100 bps), likely reflecting stronger economic growth and rising inflation expectations. While this interest rate cushion had recently been low by historical standards, it is now closer to the historical average dating back to January 1993; in fact, we have not seen a forward curve for the 10-year swap this steep since the second quarter of 2015. This indicates the market is pricing in more of a cushion for rising rates, as the forward curve represents the path that would make an investor indifferent about holding treasuries and cash. We would view this as a positive relative to the previous quarter.
EXHIBIT 2: 10-YEAR U.S. TREASURY SWAP CURVES AT QUARTERLY INTERVALS
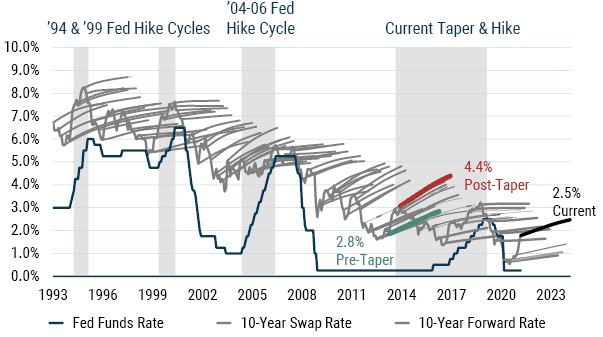
As of 3/31/2021 | Source: GMO
Liquidity
One key feature of EM is liquidity and GMO's external debt portfolio benefits from and takes exposure to the liquidity premium in EM. EM debt is a risk asset and bid-ask spreads typically widen in times of a crisis. As Exhibit 3 shows, bid-ask spreads came in by more than 140 bps since the high of 2.2% on March 23, ending the quarter at 0.8%.
Continue reading here.