


The huge variability in earnings and cash flow from year to year makes it problematic to use these numbers in a discounted cash flow (DCF) method or calculator. Instead of earning or cash flow, I think a better way of valuing the company is via the annual increase in book value per share.
Apart from paying dividends, an insurance company builds value for its investors by increasing its book value over time. Insurance companies (and banks) are what I call "balance sheet centric," i.e. they leverage their balance sheet to create value.
In this article, we will use a related but slightly different methodology to review Fairfax. While this method also uses book value as the basis, it also considers the growth of book value. I think this method is ideal to value insurance companies as well as other financial institutions like banks, which leverage their balance sheets to create value. This method is well suited for companies with erratic earnings and cash flow from year to year as well.
However, I encountered some problems in this valuation method because in some years, the "growth" was negative. Thus, I had to devise a new method to handle such data.
Consider the following table, which lays out the book value per share for Fairfax over the last 15 years. Column three provides the increase in book value per share over the previous year. Though the increase in book value is not consistent, it's easy to take the average of these increases. Therefore, we can say that Fairfax is adding on average $30.38 per share of incremental value to its book value. This is over 15 years and two business cycles, so it's a good estimate of normalized incremental book value.
Year | Book Value per share | Increase in Book value per share over previous year | % Increase (X) | Increased expressed as proportion (1+X)*1 |
2006 | $ 169.30 | |||
2007 | $ 233.78 | $ 64.48 | 38% | 1.38 |
2008 | $ 328.31 | $ 94.53 | 40% | 1.40 |
2009 | $ 389.65 | $ 61.34 | 19% | 1.19 |
2010 | $ 365.11 | $ (24.54) | -6% | 0.94 |
2011 | $ 359.03 | $ (6.08) | -2% | 0.98 |
2012 | $ 374.24 | $ 15.21 | 4% | 1.04 |
2013 | $ 360.66 | $ (13.58) | -4% | 0.96 |
2014 | $ 430.18 | $ 69.52 | 19% | 1.19 |
2015 | $ 552.65 | $ 122.47 | 28% | 1.28 |
2016 | $ 490.08 | $ (62.57) | -11% | 0.89 |
2017 | $ 574.04 | $ 83.96 | 17% | 1.17 |
2018 | $ 564.49 | $ (9.55) | -2% | 0.98 |
2019 | $ 621.63 | $ 57.14 | 10% | 1.10 |
2020 | $ 594.55 | $ (27.08) | -4% | 0.96 |
2021 | $ 624.97 | $ 30.42 | 5% | 1.05 |
Average | $ 30.38 | 11% | 1.09 | |
Arithmetic Mean ^ | Geometric Mean ^ |
The second issue is to calculate the rate of growth of book value. We can compute the year over year growth of the increase in book value in percentage and then average the results. I produced an arithmetic average, or mean, of 11%. This growth is overstated as the data has a lot of variability. A better method is to take the geometric mean. In statistics, the geometric mean is calculated by raising the product of a series of numbers to the inverse of the total length of the series.
The formula for calculating the geometric mean is:

In the formula, "n" is "number of numbers" and "X1...Xn" are the "numbers from the first to the n-th." The geometric mean is most useful when numbers in the series are not independent of each other (i.e. they are correlated) and/or if numbers tend towards large fluctuations. Another problem with the data above is that it contains several negative values. This makes calculation of geometric mean impossible though direct calculations as it would mean taking the root of a negative product and we may end up with imaginary numbers (imaginary numbers, or complex numbers, are useful in advanced mathematics but are outside the scope of this article).
However, we can transform the series of mixed negative and positive percentages to positive proportions by adding 1 and multiplying by 1 as I did in Column 5. Then it's a simple matter of calculating the geometric mean using the formula above. The geometric mean can be obtained by reversing the process of obtaining the proportions, i.e., subtracting 1 from 1.09 and dividing by 1 i.e. (1.09 - 1)/1 = 0.09 or 9%.
The above technique is described in more detail here: Geometric Mean Calculator at Giga Calculator.
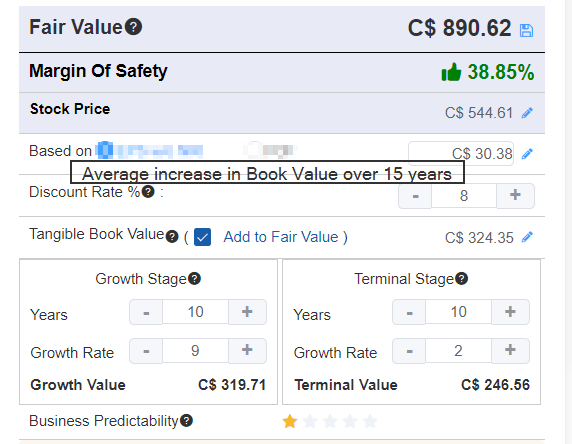
Now that we have obtained $30.37 as the normalized increment, we can input these numbers in the GuruFocus DCF calculator and estimate the intrinsic value. Note that I used a discount of 8% and assumed the book value will continue to grow at 9% a year for the next 10 years and then fall to a growth of 2%. I added the tangible book value to the final number, making the hypothetical assumption that the company will discontinue after 20 years in operation and will be liquidated at the current tangible book value. The exercise shows that Fairfax is undervalued at the current price.
Conclusion
This article shows that the Gurufocus DCF calculator can be used to value companies using average increase in Book value instead of earnings per share or free cash flow per share. I also describe a method to calculate compounded annual growth of book value using geometric mean. Finally, I demonstrate that Fairfax Financial Holdings has a considerable margin of safety at the current price.