

There are a wide variety of screeners on the GuruFocus site. Some of them apply general preset criteria to our All-in-One screener, allowing users to customize them, while others are based on a more well-defined strategy. Some even have model portfolios based on them, in which GuruFocus has tracked the performance of the screener’s top 25 stocks over the years.
In this series, I will be highlighting some of the most popular GuruFocus screeners. These are the screeners that many find to be particularly useful in searching the markets for potential investment opportunities. Each of them has their own uses depending on the criteria they look at, but they can all provide a good starting point for further research.
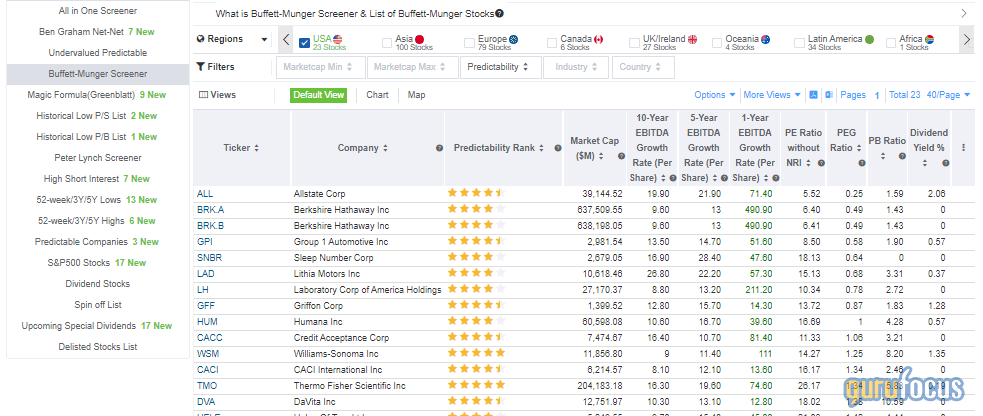
The Buffett-Munger screener
As Warren Buffett (Trades, Portfolio) famously said in one of his shareholder letters, “It's far better to buy a wonderful company at a fair price than a fair company at a wonderful price.” Of course, it’s best to buy a wonderful company at a wonderful price, but Buffett acknowledges that such opportunities are rare these days.
The above quote from Buffett is the foundation of GuruFocus’ Buffett-Munger screener, which screens the markets for high-quality companies trading at fair or undervalued prices according to the following criteria:
- A high Predictability Rank – companies with a high Predictability Rank are those that have consistently grown revenue and earnings.
- Competitive advantages – a company with competitive advantages can maintain or even expand its profit margin while growing its business.
- Low debt compared to growth – companies that incur little debt while growing business are more efficient and less likely to fail in tough times.
- Fairly valued or undervalued - GuruFocus uses PEPG as the valuation indicator for this screener; PEPG is the price-earnings ratio divided by the average growth rate of Ebitda over the past five years.
The default view of the screener displays the following categories of information about each of the stocks that make the cut:
Uses and pitfalls
The stocks that make the Buffett-Munger screener are ones that have a consistent history of profitability and growth, as well as attractive valuations for their quality.
The default list view shown above is good for getting a side-by-side comparison of the growth and value metrics of all of the companies that make the list. There are also two alternate views of the Buffett-Munger stocks: the “chart” view and the “map” view.
The chart view shows thumbnails of several different charts for each of the stocks in the screener, such as the GF Value chart, the Peter Lynch Earnings Line chart, etc.

On the map view, the stocks are shown as colored boxes that are either red, black or green. When you select one of the criteria from the drop-down menus at the top – for example, the three-year average share buyback ratio – the stocks that have a good value for that metric will display as green boxes, while the stocks that have a bad value for that metric will display as red boxes (black means the number isn’t necessarily good or bad).

One thing to watch out for is that the Buffett-Munger screener does not specifically take financial strength into account. “Incurring little debt while growing the business” doesn’t necessarily mean the company incurs little debt overall. While bankruptcy risk is relatively low across the board due to record-low interest rates, that doesn’t mean it is impossible for companies to encounter liquidity issues. That being said, the long history and success of these companies means it is unlikely for financial instability to become an issue.
In addition, we have no way to know the future. Even if a company has been successful for many years, its competitive advantages could dwindle or disappear in the future, it might transition from its growth phase to its mature phase or it might fall victim to a series of bad business decisions. The longer a company has been around, the lower its chances of providing stellar growth, though at the same time, the less risk it carries of permanent capital impairment.
Model portfolio performance
GuruFocus has a model portfolio for the Buffett-Munger screener. The model portfolio consists of the top 25 most undervalued stocks on the screener as of the day of the last rebalance (the model portfolios are rebalanced on the first trading day of the year). The stocks are given equal weighting in the portfolio, and if there are less than 25 stocks that make the cut, then the model portfolio for that year will simply consist of less than 25 holdings.
Below is a chart comparing the performance of the Buffett-Munger model portfolio to the S&P 500. Since inception, this model portfolio has typically performed close to or better than the index, outperforming significantly through 2014 before falling more in line.

Based on the history of this model portfolio, the stocks in it seem to roughly mirror the broader market on average, with a few periods of outperformance (about 30% higher than the S&P 500 around 2014 and 20% higher in early 2021). Investors looking for a combination of decent growth and low risk might find attractive opportunities among the stocks that make this screener.