

Small-Cap Value Looks Likely to Lead Amid Shifts
Our distinct experience and perspective as small cap specialists have provided a very specific lens through which we view the current market. Recent research we’ve done has led to four key observations that we develop in this piece, two that point to the continuation of existing trends and two that suggest leadership shifts: First, the economic environment and current small-cap valuations support continued solid results; second, the recent return to leadership for small-cap value looks like a sustainable trend; third, we expect a leadership shift with higher quality stocks setting the pace; and fourth, we see a stock market increasingly led by differentiation in company’s results and outlooks, offering savvy active managers numerous opportunities to outperform passive indexes.
The Positive Market and Economic Environment for Small Caps
Our view of the current state of small cap valuations is, perhaps unsurprisingly, contrarian: we see no cause for alarm. Valuations based on the equity risk premium, which incorporates current interest rates, offer a more revealing signal in our view than the more widely used P/E versus the historical range valuation metric. The current equity risk premium—the latest 12 months’ free cash flow divided by enterprise value, minus the 10-year Treasury yield—sits near the high end of the 0-1% range, which has historically preceded three-year periods with attractive results, average annualized returns in the low double digits.
Additionally, the current economic expansion seems likely to be both favorable for small caps and lead to superior results versus large caps. We turn to history for guidance. During periods of strong economic growth, small caps have enjoyed a decided performance edge over their large cap siblings. When nominal U.S. GDP growth exceeded 5% in year-over-year periods, the Russell 2000 beat the Russell 1000 65% of the time, with an average annual return of 22.1% versus 17.0%. This is especially relevant to the current environment because consensus projections call for nominal GDP growth in the 7-9% range for 2021 and 5-6% for 2022.
Small Caps Have Tended to Outpace Large Caps in Periods of High Economic Growth
Russell 2000 vs Russell 1000 Regimes
From 6/30/01 to 6/30/21
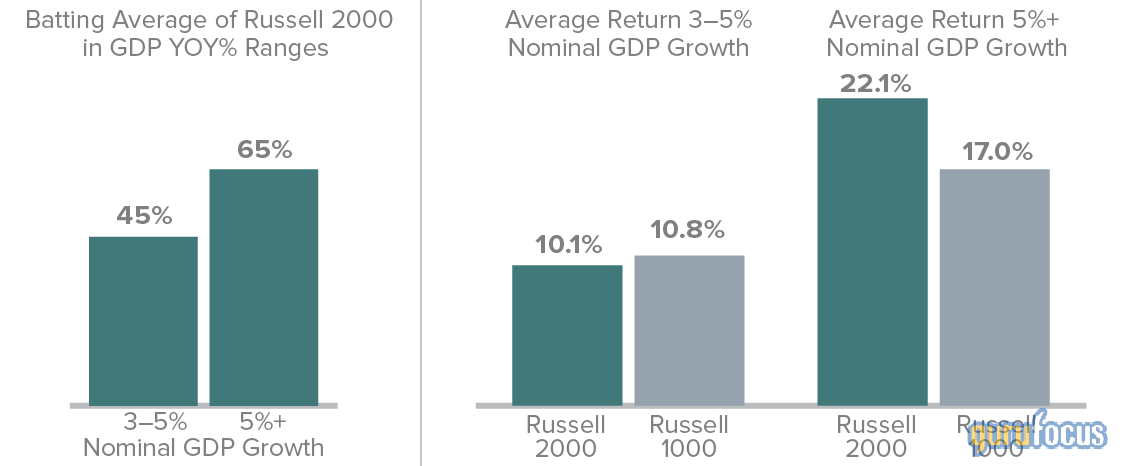
Past performance is no guarantee of future results. Batting Average refers to the percentage of 1-year periods in which the Russell 2000 Index outperformed the Russell 1000 Index.
Though we are optimistic about the prospects for small caps in the current market and economic environments, we hasten to add that we also expect results to moderate from the most recent five-year annualized period for the Russell 2000—which was 13.5% for the period ended 9/30/21.
Why the Small-Cap Value Cycle Looks Likely to Last
In addition to looking for small caps to continue posting attractive results, we also expect small-cap value to continue leading within small cap—and for the same reason as small cap’s relative advantage over large caps: Small-cap value has enjoyed a pronounced tendency to outperform small-cap growth when nominal economic growth has been above average. In our studies, nominal GDP growth provides not only a more promising signal of small cap beating large cap but is also a more revealing sign than real GDP growth when analyzing style leadership. Our hypothesis is that small-cap value is both more cyclically sensitive than its growth sibling and a greater beneficiary of inflation for relative earnings growth and valuation.
We looked back over the past 20 years and discovered that in one-year periods with at least 5% nominal GDP growth, the Russell 2000 Pure Value Index outperformed the Russell 2000 Pure Growth Index 70% of the time by an average of 420 basis points. In contrast, when nominal GDP growth fell between 3-5%, the small-cap value index outperformed only 32% of the time and lagged small-cap growth by an average of 100 bps. Keeping in mind the bright forecasts for the global economy we mentioned above, this pronounced edge for small-cap value looks particularly timely.
Strong Economic Expansion Has Favored Value
Rolling 12 Month Returns for the Russell 2000 Pure Value vs Russell 2000 Pure Growth Indexes from 6/30/01 to 6/30/21.
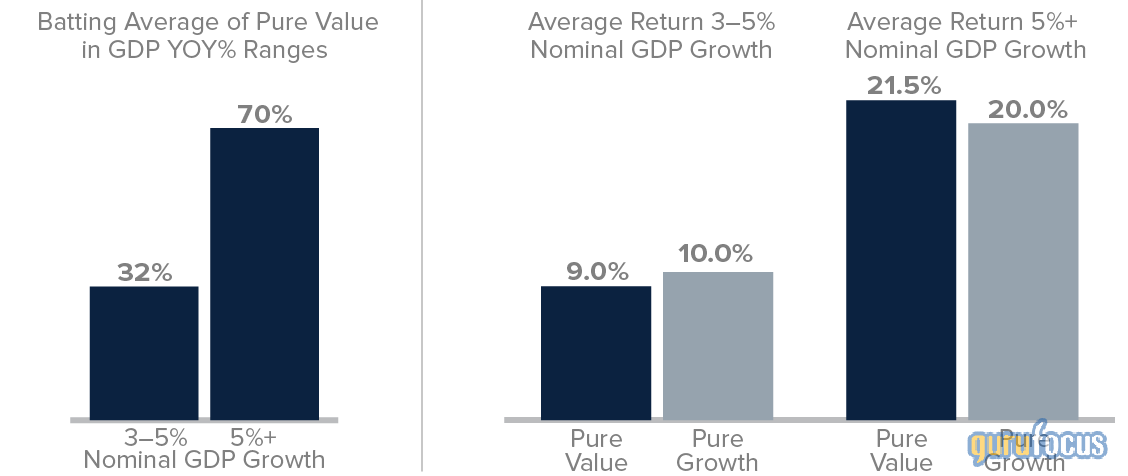
Past performance is no guarantee of future results. Batting Average refers to the percentage of 1-year periods in which the Russell 2000 Pure Value Index outperformed the Russell 2000 Pure Growth Index.
Relative Valuations Favor Value
Despite small-cap value’s recent strong performance, it remains significantly undervalued compared to small-cap growth. In fact, using our preferred valuation metric, Enterprise Value/Earnings Before Interest and Taxes (EV/EBIT), small-cap value was near its lowest relative valuation versus growth in 20 years at the end of 1Q21. We think this extreme relative valuation spread suggests that there’s more to come for small-cap value’s outperformance.
Small-Cap Value Sells at Its Lowest Valuation to Growth in More Than 20 Years
Russell 2000 Value and Growth Shifted Median Relative LTM EV/EBIT1
Russell 2000 Value/Growth from 3/31/00 to 9/30/21
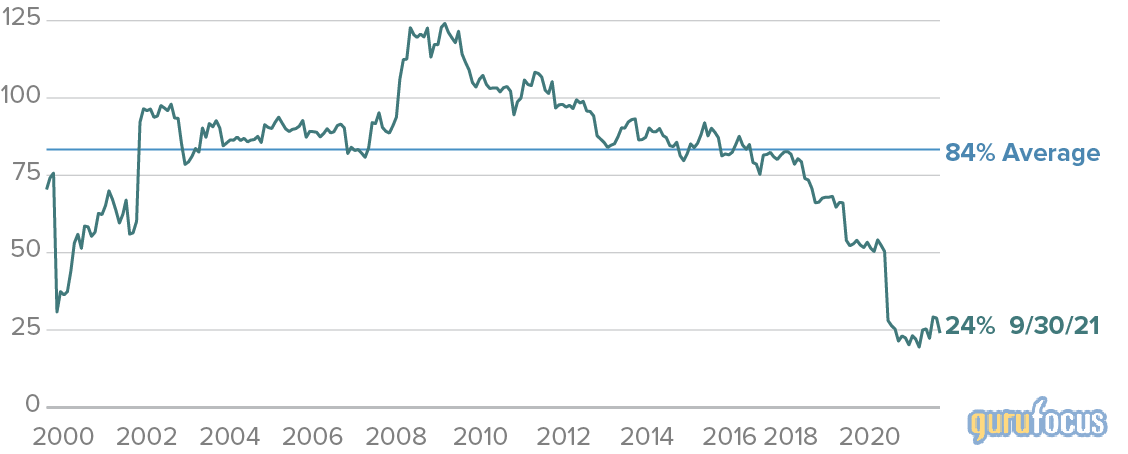
1 Last twelve months enterprise value/earnings before interest and taxes.
Past performance is no guarantee of future results.
Source: FactSet
Durable Value
One recent performance pattern that we think is notable is that small-cap value has beaten small-cap growth in all three quarters in 2021, though each quarter featured a different market environment. As shown in the chart below, small-cap value led in the high performing 1Q, the more modest returning 2Q, and in a declining period in 3Q. Outperformance in both up and down periods shows durability and suggests to us that small-cap value’s leadership is likely to endure.
Small-Cap Value’s Durability in Different Market Environments
2021 YTD Quarterly Returns for the Russell 2000 Value vs. Russell 2000 Growth
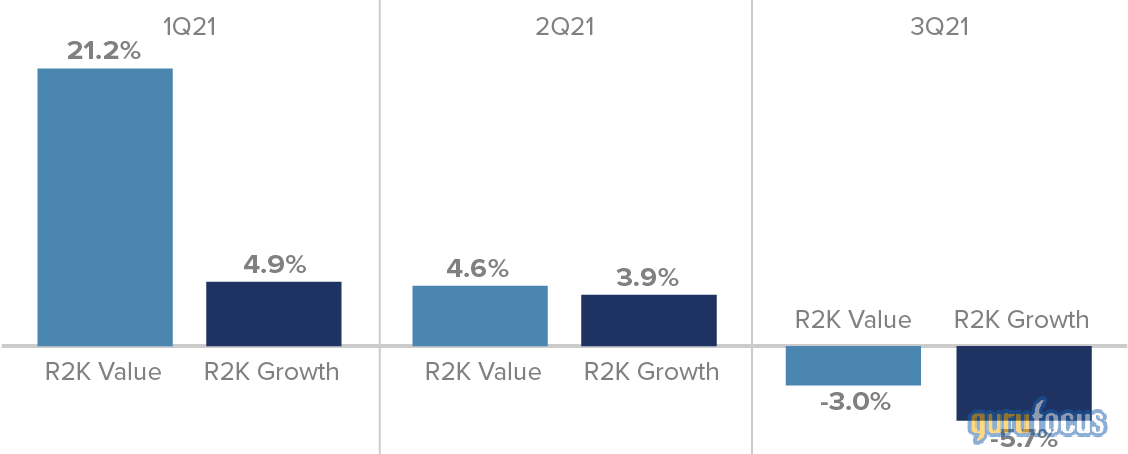
Past performance is no guarantee of future results.
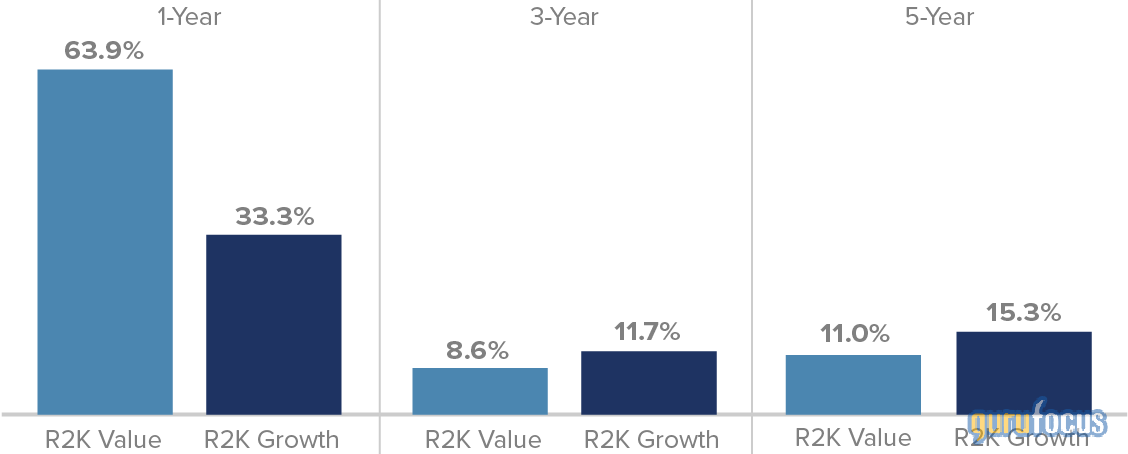
Despite Leading for 1 Year, Small-Cap Value Has Room to Run
Some commentators have raised concerns about investing in small-cap value after its significantly better returns than small-cap growth over the past year. Yet history suggests these apprehensions may be misplaced. Small-cap value ‘s leadership is also relatively new. Looking at the small-cap style index returns over longer-term periods shows that the Russell 2000 Value continues to lag the Russell 2000 Growth over the trailing three- and five -year annualized periods—another observation which indicates to us that the small-cap rally has room to run.
Despite Leading from One Year, Value Trails by a Large Margin for Three- and Five-Year Periods.
Russell 2000 Value vs Russell 2000 Growth Annualized Returns
As of 9/30/21
What Might Change: High Quality Ascending?
One of the patterns we have seen over the course of multiple small-cap market cycles is a leadership rotation from low-quality small caps to high-quality small caps as the cycle matures. While Royce’s portfolio managers use multiple parameters to identify high-quality businesses, for purposes of illustration we’re using a multi-factor model with a company’s returns on invested capital and five-year average return on assets as a proxy for quality.
We analyzed the performance for the 10% of small caps with the highest combined score for this multi-factor quality metric. Our study revealed an illuminating pattern over the last four full small cap cycles. In the decline phase (market peak to trough), high-quality stocks declined on average less than the index, a pattern that reversed in the first year after the market trough, when the average return of high-quality small caps lagged the index. However, the leadership pattern reversed again in the second year of the cycle, when high quality stocks regained the lead.
This result is consistent with our own experience, in that market rebounds are initially driven largely by valuation expansion, where the lowest quality stocks rebound the most off their relatively more depressed valuations and high-quality lagging in the initial rebound. Nevertheless, after valuations return to a more historically typical range, the differentiation between company fundamentals begins to drive relative results. And in a more fundamentally focused market environment, the superior attributes of high-quality companies really shine.
High Quality Has Seen a Consistent Relative Return Profile Over Past Four Full Market Cycles
Average Performance for High Quality1 in Past Four Market Recoveries as 9/30/21
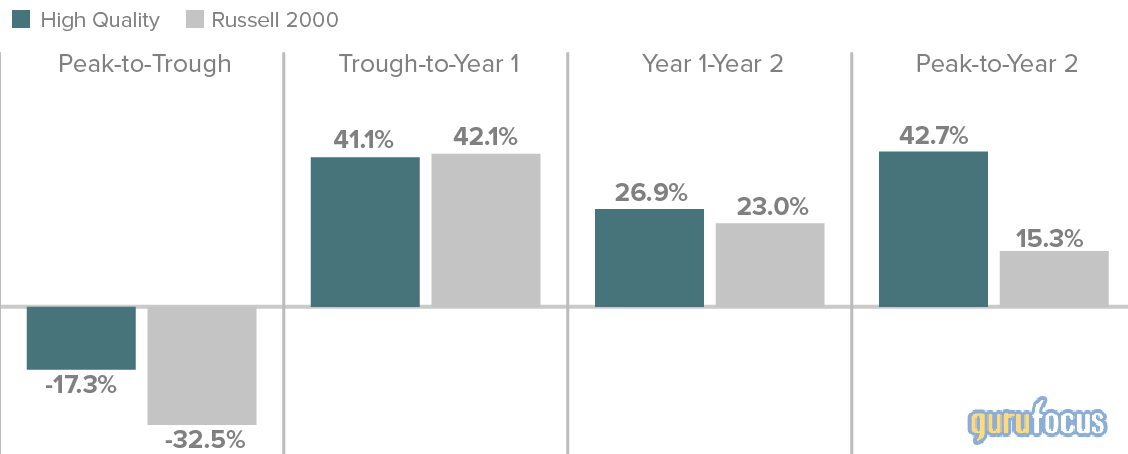
1 High Quality: The top decile of securities in the Russell 2000 sorted by a combination of ROIC and stability of ROA.
The Russell 2000 peak and trough dates are based on month ends 2/29/00-9/30/02; 5/31/07-2/28/09; 4/30/11-9/30/11; 6/30/15-2/29/16
Past performance is no guarantee of future results.
Increased Fundamental Differentiation Is Active Management’s Opportunity
We believe that the market is now at a point where greater differentiation in small-cap companies’ fundamental results will begin to affect share prices. The pandemic offered many quality business models the opportunity to prove their durability, just as it gave strong managements a chance to prove their mettle. Even those quality companies in industries hit hardest by the pandemic were able to bolster their competitive position and are now poised to emerge with greater earnings and cash flow power as the economy reopens. Many of the defensive measures that companies took to preserve cash flow have evolved into permanently reduced cost structures, such as smaller real estate footprints from permanent moves to hybrid or full work from home models. These actions, combined with the proactive moves many of our quality companies made while their smaller or more highly leveraged competitors were focused mostly on survival, have strengthened their moats, broadened their addressable markets, and/or increased their long-term, “normalized” operating margins relative to pre-pandemic levels
Set a Course for Small Cap
It’s no secret that small caps have been leading the equity markets over the past 12 months and that within small cap value is enjoying a dynamic resurgence. Small-cap stocks in general—and value in particular—have done so well over the last 18 months that certain investors might be under the impression—mistaken in our view—that leadership stints for both may be nearing their end. We could not disagree more. Even allowing for the differences among their distinct strategies, most of our portfolio managers continue to identify common areas and/or themes where they are finding attractive opportunities. While we think small cap’s returns will slow somewhat from their recent pace, we also think that a still recovering global economy, along with above average inflation, will produce a market environment that supports small cap leadership over large cap, and small-cap value outperformance versus small-cap growth.
Mr. Lipper’s thoughts and opinions concerning the stock market are solely their own and, of course, there can be no assurance with regard to future market movements. No assurance can be given that the past performance trends as outlined above will continue in the future.