

As investors ring in the New Year, GuruFocus’ Premium value screens continue seeking opportunties for 2022.
GuruFocus’ value screens apply teachings from investing legends like Ben Graham, Peter Lynch and Berkshire Hathaway Inc. (BRK.A, Financial)(BRK.B, Financial) co-managers Warren Buffett (Trades, Portfolio) and Charlie Munger (Trades, Portfolio).
US markets start New Year with gains
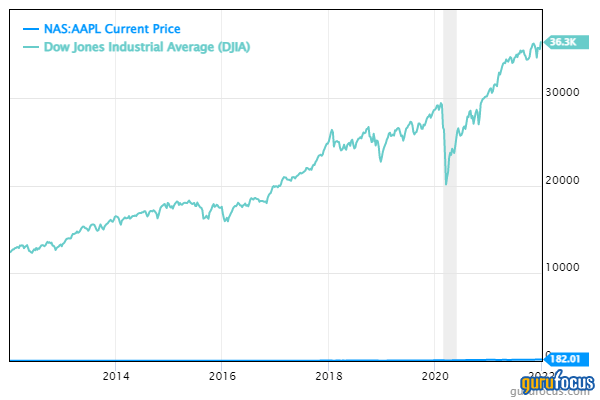
On Monday, the Nasdaq Composite Index closed at 15,832.80, up 187.83 points from the previous close of 15,644.97. Shares of Tesla Inc. (TSLA, Financial) surged over 10% on the back of reporting a record 936,172 vehicle deliveries for 2021, including 308,600 deliveries during the fourth quarter.

Likewise, the Dow Jones Industrial Average closed at 36,585.06, a new record close and up 246.76 points on the back of consumer electronics giant Apple Inc. (AAPL, Financial) briefly hitting a $3 trillion market cap at the intraday high.
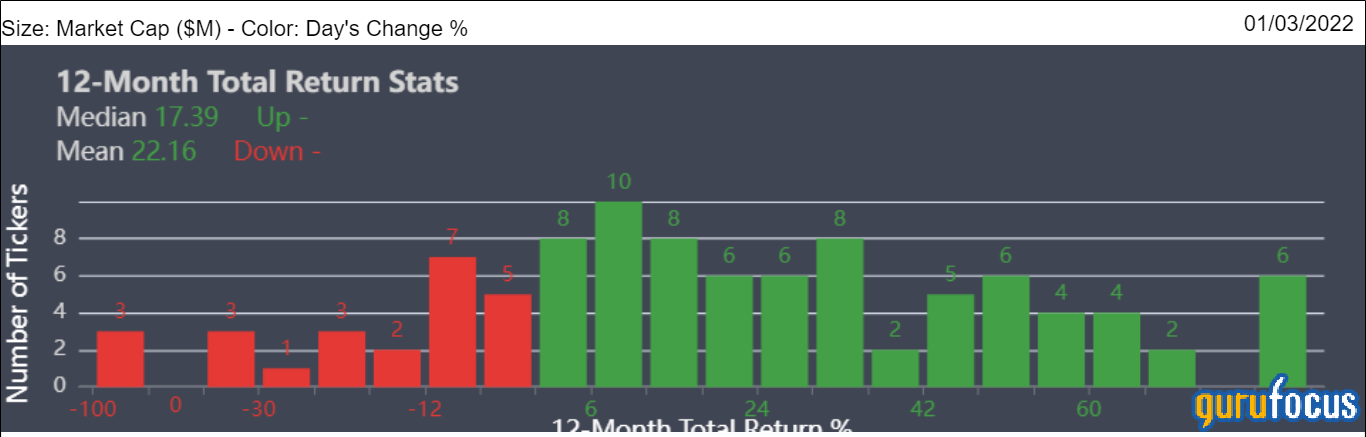
According to the Aggregated Statistics chart, the mean one-year total return for the Nasdaq 100 stocks is 22.16% with a median of 17.39%.
GuruFocus provides a wide range of value screeners for Premium members
GuruFocus provides several value screeners for its Premium members, including the Ben Graham Net-net Screen, the Undervalued-Predictable Screen, the Buffett-Munger Screen and the Peter Lynch Screen. Table 1 lists the number of stocks making each of the value screens as of Monday.
| Screener | USA | Asia | Europe | Canada | UK / Ireland | Oceania | Latin America | Africa | India |
| Ben Graham Net Net | 207 | 452 | 231 | 43 | 16 | 7 | 13 | 8 | 151 |
| Undervalued-Predictable | 161 | 277 | 300 | 22 | 44 | 7 | 139 | 19 | 74 |
| Buffett-Munger | 23 | 101 | 80 | 6 | 15 | 4 | 25 | 2 | 33 |
| Peter Lynch | 72 | 100 | 60 | 3 | 3 | 1 | 17 | 5 | 5 |
Table 1
Ben Graham’s Net-net Screen seeks to identify stocks that are trading at less than 66% of net current asset value. On the other hand, the Undervalued-Predictable and Buffett-Munger Screeners look for stocks that meet Berkshire’s key criteria, which include predictable revenue and earnings growth and low valuations based on either the discounted cash flow model or the price-earnings-to-growth ratio.
Table 2 lists the number of stocks making other value screens as of Monday.
| Screener | USA | Asia | Europe | Canada | UK / Ireland | Oceania | Latin America | Africa | India |
| Historical Low Price-Book | 142 | 245 | 117 | 8 | 33 | 3 | 61 | 13 | 44 |
| Historical Low Price-Sales | 105 | 196 | 89 | 1 | 24 | 1 | 44 | 9 | 30 |
| 52-week Lows | 582 | 1649 | 527 | 83 | 87 | 29 | 133 | 9 | 128 |
| 52-week Highs | 196 | 544 | 173 | 30 | 62 | 26 | 29 | 33 | 825 |
| Dividend Stocks | 119 | 51 | 149 | 3 | 21 | 8 | 41 | 11 | 22 |
Table 2
Also check out: