

Oil and gas stocks can be powerful growth engines when prices are favorable or on the way up. But, these stocks also can sting investors when prices drop, as we’ve seen over the past seven years.
One alternative to a pure-play oil company is Texas Pacific Land Corp. (TPL, Financial), a company that has a different approach to the industry.
About Texas Pacific
Based in Dallas, Texas and registered in Delaware, the $9.40 billion company does not drill for oil and gas, operate mid-stream facilities, or distribute petroleum products.
Instead, it owns land, a lot of land, on which oil and gas companies explore, drill and process. Texas Pacific collects rent, royalties and other income streams from those companies.
This slide, from its December 2021 (post-third-quarter) investor presentation, shows its revenue segments (SLEM = Surface Leases, Easements and Material Sales):

It is one of the state’s largest landowners, with more than 880,000 acres in the Permian Basin. The Basin was given new life in the past two decades, as new technologies, including horizontal drilling and hydraulic fracturing, led to significant increases in light, sweet oil production.
In its 10-K for 2020, Texas Pacific explained its strategy (I have broken one long paragraph into several paragraphs, along with emphasis, to make the quotation more readable):
“Our surface and royalty ownership allow steady revenue generation through the entire value chain of oil and gas development. While we are not an oil and gas producer, we benefit from various revenue sources throughout the life cycle of a well.
“During the initial development phase where infrastructure for oil and gas development is constructed, we receive fixed fee payments for use of our land and revenue for sales of materials (caliche) used in the construction of the infrastructure.
“During the drilling and completion phase, we generate revenue for providing sourced water and/or treated produced water in addition to fixed fee payments for use of our land.
“During the production phase, we receive revenue from our oil and gas royalty interests and also revenues related to saltwater disposal on our land.
In addition, we generate revenue from pipeline, power line and utility easements, commercial leases, material sales and seismic and temporary permits principally related to a variety of land uses, including midstream infrastructure projects and processing facilities as hydrocarbons are processed and transported to market.”
The company operated as a trust until Jan. 11, 2021, when it converted to a conventional publicly-traded corporation. It is also one of the market’s more expensive stocks, closing at $1,213.070 on Jan. 10, 2022. However, that doesn't necessarily make it overvalued.
Competition
The company argued in the 10-K that it does not have any direct competitors, given the scope of its landholding (originally owned by the Texas & Pacific Railway). It does see some competition for its water sales, but again it is by far the largest supplier.
As a result, we can assume the company has at least two competitive advantages or moats that would be incredibly difficult if not impossible to take down.
Risks
Although its financials are less sensitive to oil and gas prices than producers and others in the industry, Texas Pacific still has exposure:
- The royalties it collects vary with the price of oil, obviously going down when oil prices fall and rising when they increase.
- Land sales: The average price per acre and the number of acres sold vary according to industry confidence, and that confidence varies with oil prices.
- Demand for water and other materials fluctuates with the amount of oilfield activity, which also reflects oil prices and economic conditions.
Other risk factors include:
- The long-term trend toward decarbonization.
- Government rules and regulations.
- The corporate bylaws contain provisions to block coercive or hostile takeovers (“poison pills”) that may not be in the best interests of shareholders.
Financial strength

The first four lines of the company's GuruFocus Financial Strength chart, plus the Altman Z-Score, make it clear the company has little debt and is financially sound. More specifically, a check of the balance sheet shows $94.6 million in liabilities (including $2.3 million in long-term debt) versus $695.6 million in total assets.
How has it managed the capital it received from investors and lenders? According to the return on invested capital (ROIC) versus weighted average cost of capital (WACC) ratio, management has done very well: it has a WACC of 16.84% and a ROIC of 83.99%.
As for free cash flow, the story is not so straightforward. As the below chart tells us, free cash flow rose quickly between 2016 and 2019, then began falling a year before the pandemic began. In 2021 it began to recover:

Profitability
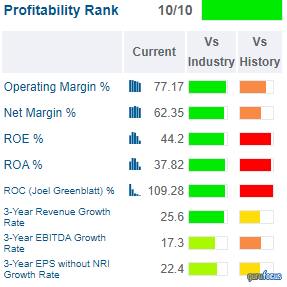
Of the thousands of stocks covered by GuruFocus, only 15 score a perfect 10-out-of-10 for profitability. As shown in the GuruFocus Profitability chart above, Texas Pacific is one of the 15.
That’s not surprising when you look at the details on the profitability table. Every line impresses, from margins to return on equity and Ebitda growth.
Performance
We get another hint of Texas Pacific's strength in this annual returns comparative chart, which shows Texas Pacific in blue, Devon Energy Corporation (DVN, Financial) in red and the SPDR Oil & Gas Exploration and Production ETF (XOP, Financial) in dark gray:
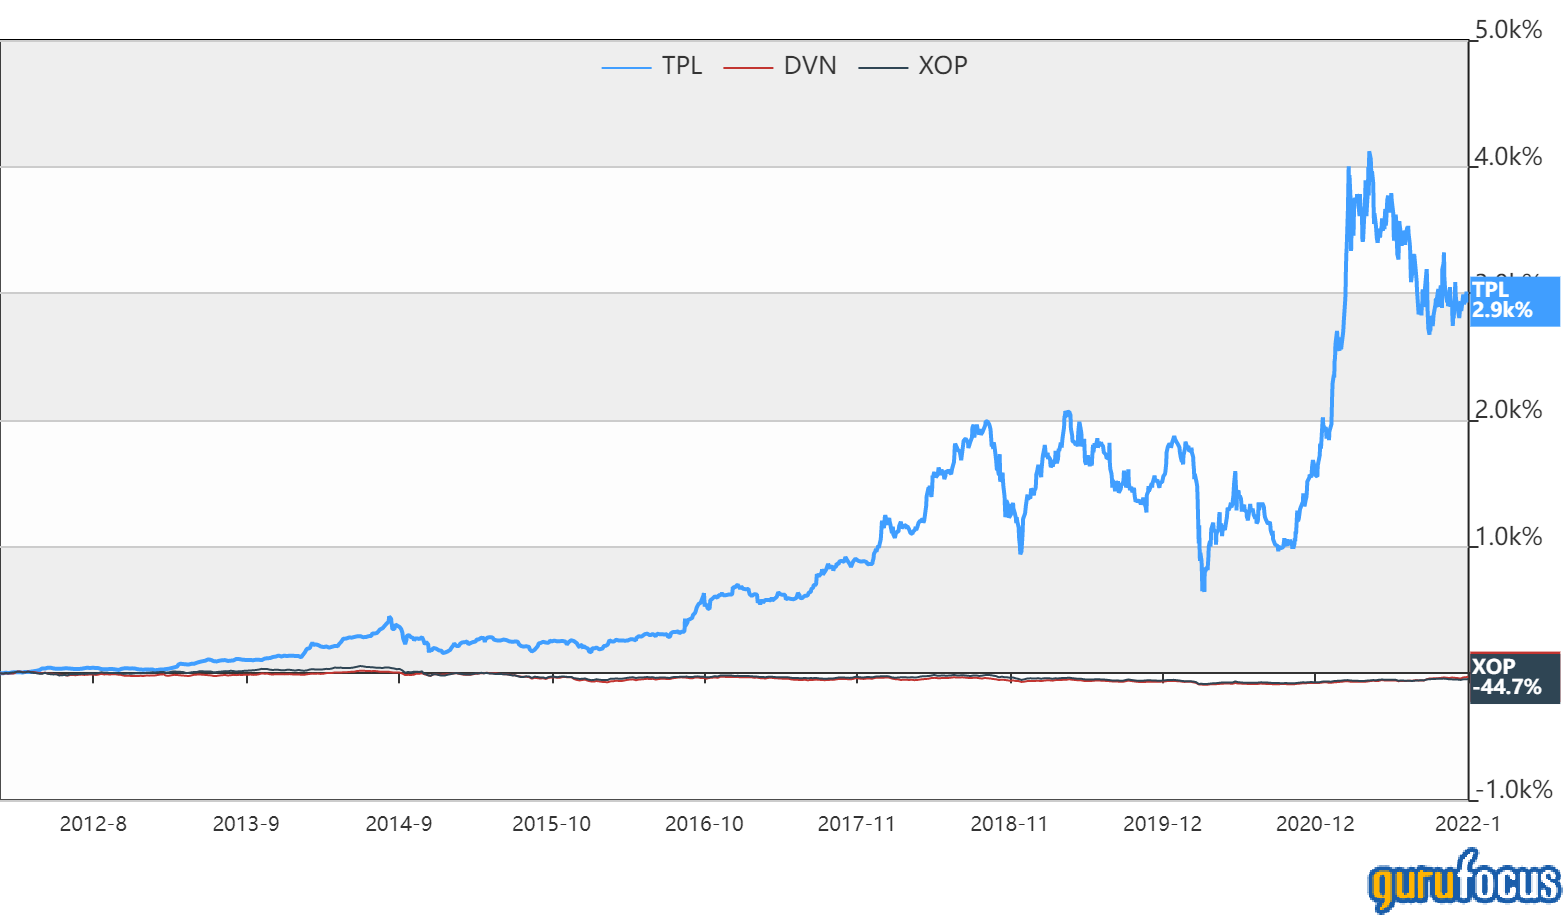
Texas Pacific has posted the following total annual returns:
- 2021: 71.78%.
- 2020: -6.94%.
- 2019: 44.23%.
- 2018: 21.27%.
- 2017: 50.50%
From another perspective, these are the average annual returns over multiple periods:
- One year: 63.24%.
- Three years: 28.10%.
- Five years: 32.53%.
- Ten years: 41.35%.
Dividends

Over the past three quarters, Texas Pacific has paid dividends of $2.75 per quarter, or $11.00 annually. That would seem rich if the stock price were not over a thousand dollars: $1,213.07 at the close on Monday. The price rose dramatically in 2021, so the dividend yield has fallen considerably.
The dividend payout ratio is 27%, meaning there is room for future increases. If free cash flow continues to rise, the company may increase the dividend this year and in succeeding years. The growth rate shown in the table reflects the big increase in 2021.
Valuation

Texas Pacific's GuruFocus Valuation chart is showing a lot of red. As the following 10-year price chart shows, the share price rose quickly between October 2020 and March 2021, and then trended downward:

The price-earnings ratio is hot, higher than 86.27% of other companies in the oil and gas sector.
However, when we factor in the high Ebitda growth rate, averaging 41.70% per year for the past five years, the PEG ratio works out to 0.96, just four basis points below the fair-value mark.
Texas Pacific has a strong predictability score, 4.5 out of 5 stars, so we can put reasonable confidence in the discounted cash flow (DCF) calculation:

As we see, the DCF calculator generates a fair-value valuation while using the assumptions shown above.
On the other hand, the GuruFocus Value chart arrives at a significantly overvalued conclusion:
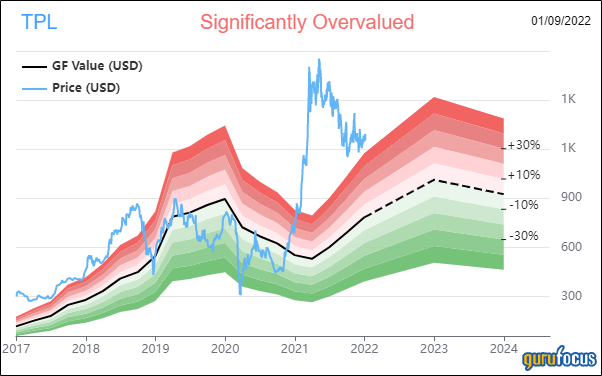
The GF Value is a valuation measure unique to GuruFocus that considers a stock's historical multiples, its past returns and analyst estimates of future business performance.
Shareholders
Over the past decade, the share count has come down slowly but steadily:

In the third quarter of 2021, the number of guru buy and sell transactions was equal:
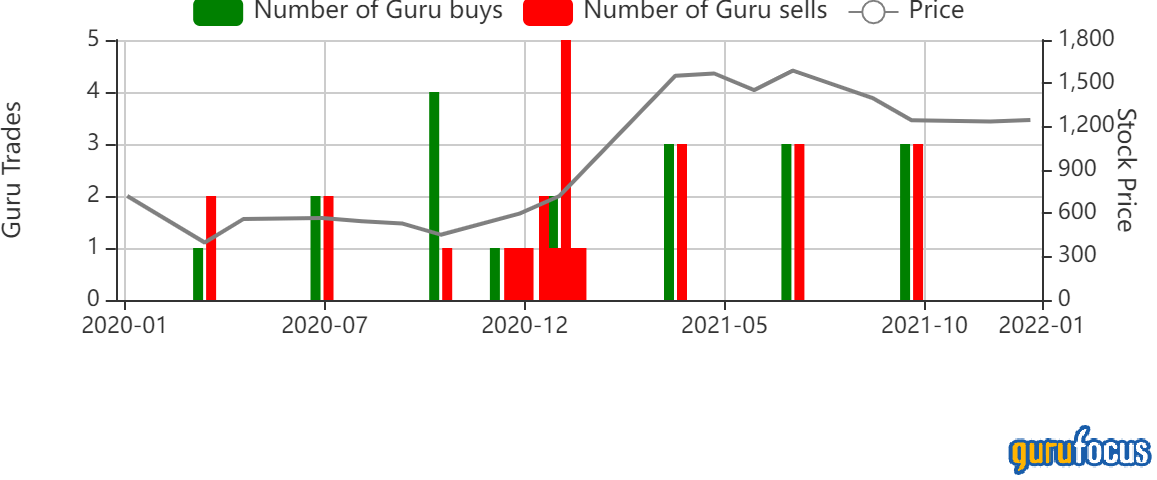
At the end of September, six gurus held Texas Pacific stock. The three largest holdings were those of:
- Murray Stahl (Trades, Portfolio) of the Horizon Kinetics fund, who owned 1,539,103 shares representing 19.86% of Texas Pacific’s stock and 43.81% of the fund’s holdings.
- Tom Gayner (Trades, Portfolio) of Market Gayner Asset Management, who added 53.33% and finished the quarter with 6,900 shares.
- Keeley-Teton Advisors, LLC (Trades, Portfolio), which cut its holding by 8.44% to finish the quarter with 3,440 shares.
For a fascinating insight into why Stahl and Horizon Kinetics continue to hold Texas Pacific, I recommend taking a look at Stahl’s Q1-2021 Commentary.
Conclusion
Texas Pacific Land Corp. is an expensive stock based on some measures. Yet it is also a fairly-valued stock by several metrics as well, largely because it has grown its Ebitda so quickly. That growth matters because it provides increasing free cash flow that can generate even higher earnings in the following years.
It receives high scores for both financial strength and profitability, while its valuation is considered fair. Moreover, thanks to its diversification, it should withstand shocks in oil prices more readily than pure-play companies.
Value investors will like the lack of debt and growth trend; however, many also will be hesitant because there is no margin of safety. Income investors won’t find much of interest here, but growth investors might want to take a closer look at its potential to keep increasing its Ebitda.