

Coping with the Small-Cap Bear
In a quarter that saw significant geopolitical tumult, in addition to the ongoing challenges of inflation, supply chains, and a meaningful Fed pivot, the small-cap Russell 2000 Index entered a classic bear market—that is, a decline of 20% or more—during 1Q22. Interestingly, however, the small-cap index did so nearly a month prior to the Russian invasion, hitting its year-to-date low on 1/27/22, when it was down 20.7% from its previous high on 11/8/21. As uncertainty increased (and earnings expectations corrected), small-caps somewhat paradoxically advanced. January was the only negative performance month for the Russell 2000 in 1Q22.
Still, small-cap stocks have borne the brunt of the declines thus far. The large-cap Russell 1000 Index fell 13.3% from its most recent high on 1/3/22 through its year-to-date low on 3/14/22. In addition, small-cap results were in the red over the last 12 months, something we suspect that many investors may not be aware of. The one-year return for the Russell 2000 through 3/31/22 was a loss of 5.8% compared to a gain of 13.3% for the large-cap Russell 1000 Index for the same period.
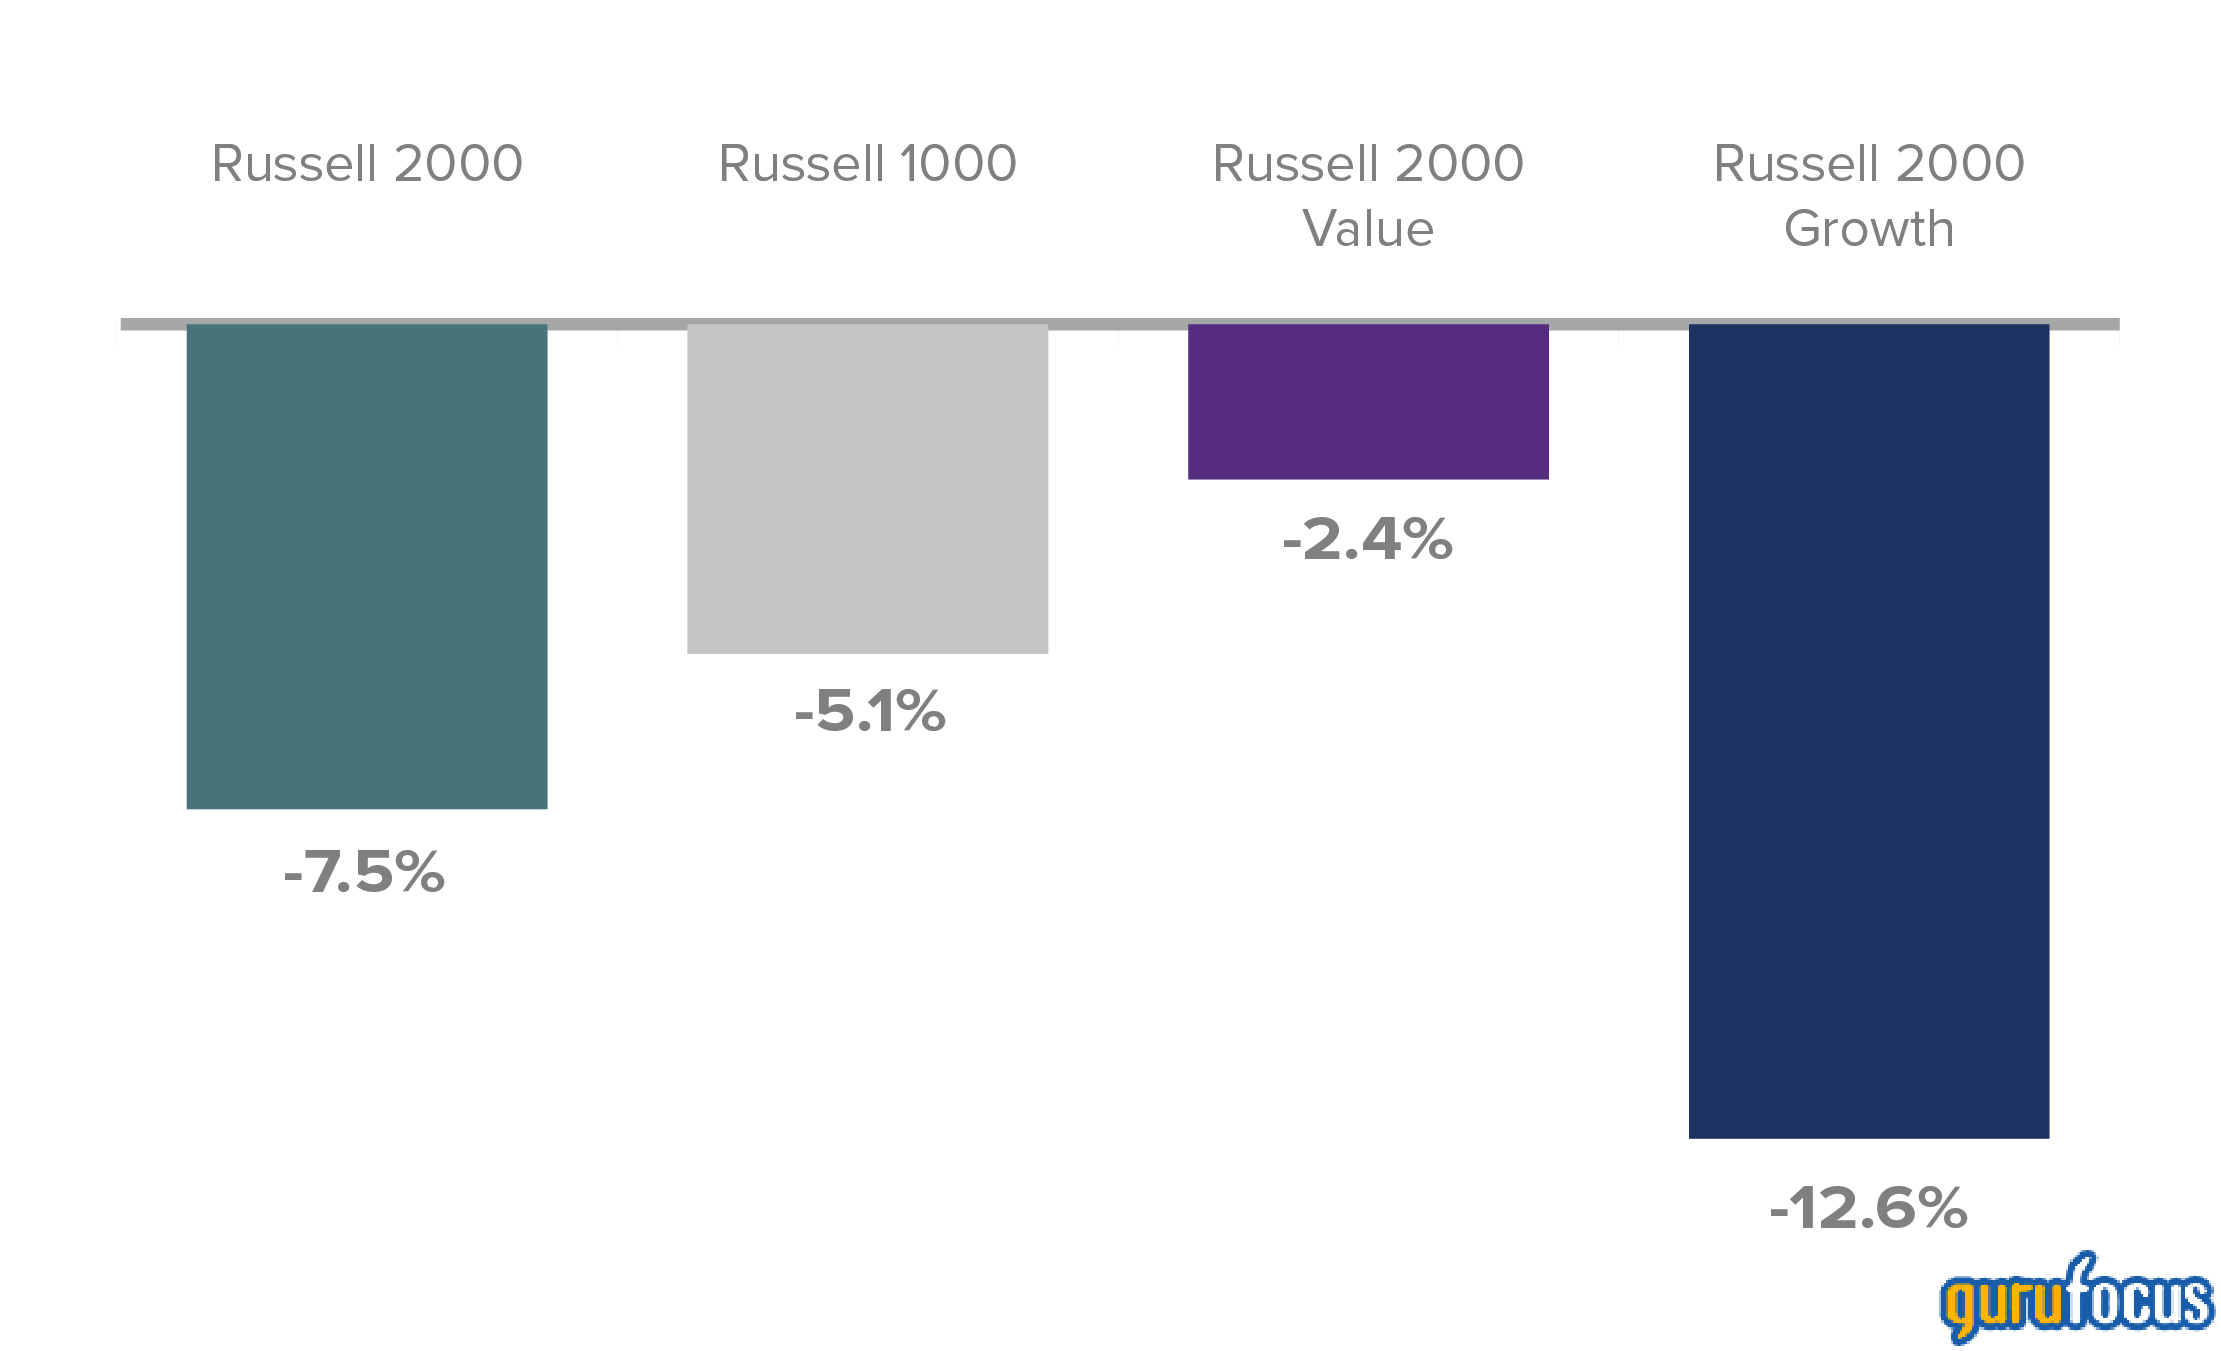
For 1Q22, this corrective pattern held, despite a March mini rally throughout the U.S. equity markets. The Russell 2000 was down 7.5% for the first quarter versus a loss of 5.1% for the Russell 1000. This was not a surprising result as the downward trend that’s been afflicting U.S. equities is consistent with the long-term historical tendency that shows small-caps losing more during most widespread market corrections. (More encouragingly, history also offers ample evidence of small-cap making up lost ground during subsequent reversals.)
1Q22 Returns for the Russell 2000, Russell 1000, Russell 2000 Value, and Russell 2000 Growth Indexes
As of 3/31/22
Past performance is no guarantee of future results
Small-Cap Value Shows Resilience
As was the case in calendar 2021, the best news for small-cap investors in 1Q22 seemed to come from value stocks. The Russell 2000 Value Index fell 2.4% in 1Q22, compared to a decline of 12.6% for its style sibling, the Russell 2000 Growth Index, for the quarter.
A significant share of the relative strength for small-cap value is likely attributable to the steep rise in the 10-year Treasury yield, which began to climb in January, beginning the year at 1.63% and finishing March at 2.32%. Small-caps as a whole have typically done well—on both an absolute basis and versus large-caps—when interest rates rise. Within small-cap, value has also historically outpaced growth as rising rates have historically affected the style indexes differently. During January, for example, when rates first began to move up consistently, the Russell 2000 Value lost significantly less than the Russell 2000 Growth. Similarly, while both small-cap style indexes had positive returns in February and March, the Russell 2000 Value decidedly beat its growth sibling in each month.
What Are Rising Rates Signaling?
One important caveat to mention while discussing historical patterns is that we have not seen yields rise (and bond prices fall) during a market correction in more than a decade. We also observed that the expected flight to safety into bonds after the war began did not materialize. So, it’s not entirely clear at this stage what rising yields and a recently inverted yield curve are signaling. It could be a reaction to the Fed’s decision to raise rates multiple times this year, with the bond market getting out in front of monetary policy; it could also be a response to a still expanding economy—or a combination of both. In any event, rising rates are nearly always a bellwether, and we will continue to watch their direction—as well those of as high-yield spreads—insofar as we see them potentially affecting small-cap valuations and performance, as they have historically.
Small-Cap Earnings Expectations Slacken
We also observed that, based on FactSet’s Market Aggregate calendar-year 2022 estimates, earnings expectations for small-caps fell in concert with GDP estimates being revised downward in 1Q22—while those for large-cap stocks continued to rise--which indicates that Wall Street’s consensus has more confidence for large-cap earnings growth than for small-cap's.
Earnings Estimates for Large-Cap Rose While Small-Cap's Fell
FactSet Market Aggregate Estimated Weekly % Change in Year-to-Date Earnings per Share Revisions for the Russell 2000 vs. Russell 1000 From 12/31/21 through 3/31/22
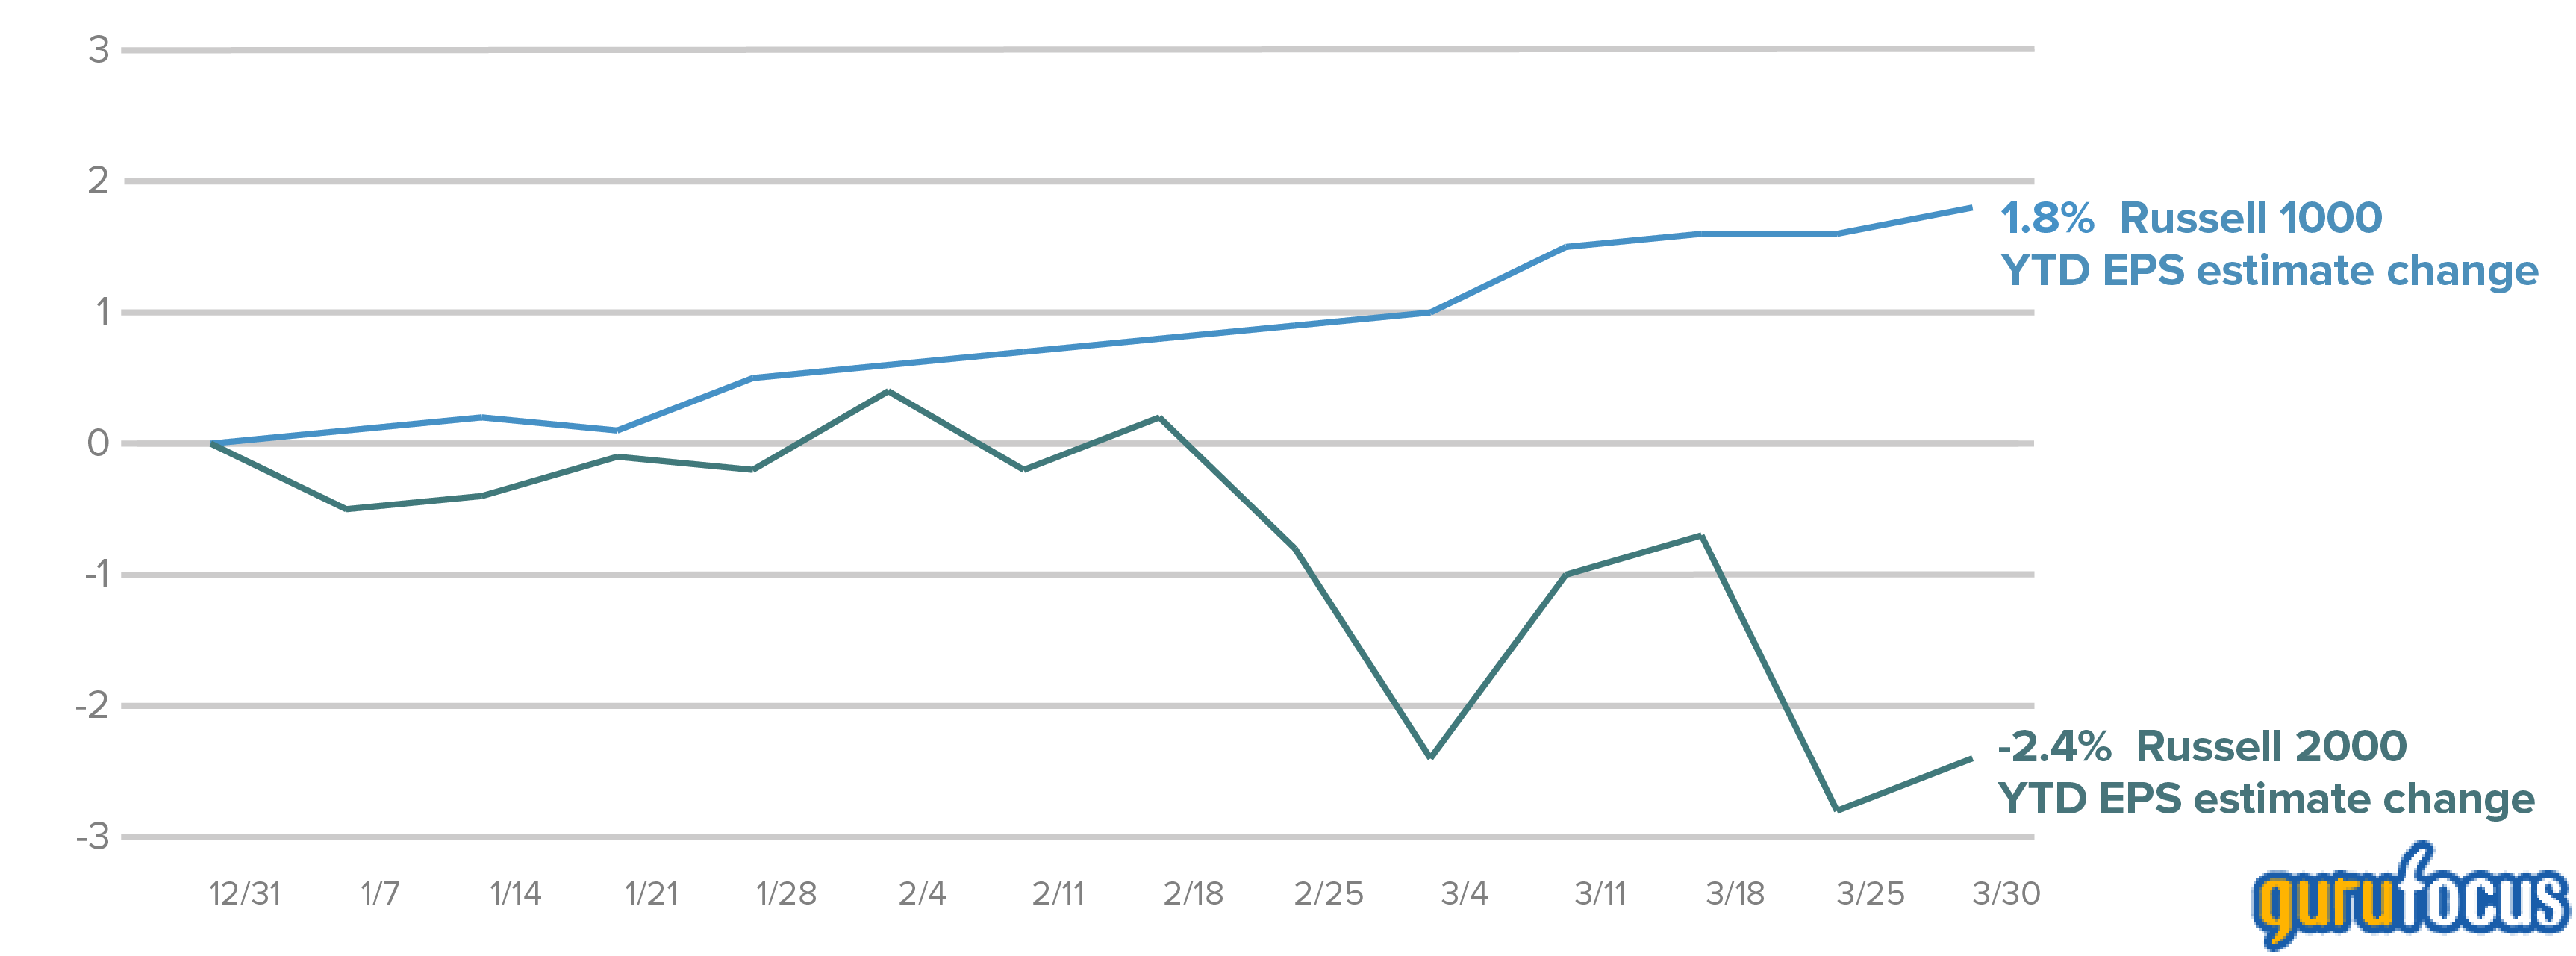
The chart measures the weekly YTD percentage change in 2022 earnings estimates, based on revisions. For the Russell 2000, aggregate earnings estimates were revised downward from 237.85 on 12/31/21 to 232.21 on 3/31/22—a decrease of 2.4%. For the Russell 1000, aggregate estimates were revised from 235.85 on 12/31/21 to 240.09 on 3/31/22 for an increase of 1.8%. Each represents weekly % changes to 12/31/21 Calendar Year 2022 earnings estimates. Source: FactSet
While it’s often true that cyclical stocks get hurt more when economic momentum slackens—or is expected to—the first quarter’s downward earnings revisions for small-cap were mostly driven by dramatically lower expectations for the Russell 2000 Growth. From our perspective, cyclical sectors such as Information Technology, Industrials, and Financials experienced more of an interruption than a correction in both performance and in revised expectations as investors understandably sought to make sense of the unsettled geopolitical landscape while simultaneously dealing with the effects of inflation and ongoing, related supply chain issues. The currently uncertain economic environment notwithstanding, we also see, in certain cases, more promising long-term earnings prospects than the consensus suggests.
What Has Typically Followed Negative First Quarters for Small-Cap?
Since its inception in 1979, the Russell 2000 has had a negative return in 16 out of 44 opening quarters, or a little more than one third of the time. What we find notable, beyond the comparably rare occurrence of negative performance to open the year, is that 93% of the previous 15 12-month periods following these negative first quarters were positive—and averaged an impressive 32.7% return.
We are not anticipating a return quite that lofty over the next 12 months, but we do think that positive, albeit moderate, results for small-cap stocks are likely over the next four quarters. Our contention is rooted not just in this history but also in the fact that, in spite of some very solid to impressive earnings growth over the last year for many small-cap companies, the Russell 2000 has spent the last 12 months in the red, which suggests to us that many investors have yet to recognize some of the fundamental strengths and/or growth prospects among many small-cap companies.
What Volatility Suggests about Small-Cap’s Returns
The lack of visibility around the pace of global economic growth has undoubtedly contributed to investors’ anxiety, which is an understandable response to both our current inflationary climate and the extraordinary sorrows wrought by the war. We often look at volatility through the lens of trading days when the Russell 2000 moves up or down by at least 1%. By this measure, 1Q22 was an especially tumultuous period. Over the last 30 years, 34% of the trading days have experienced such a move. In 1Q22, however, 71% of the trading days experienced an up or down move of at least 1%, more than double this long-term average.
Of course, the best-known volatility measure is the VIX, which tracks the market’s expectations for near-term volatility. Its recent moves have been almost equally dramatic—and its higher-than-average range in the first quarter offers some interesting historical parallels. Higher-than-average volatility indicates that risk aversion is running higher than usual. Yet investor sentiment has historically been a contrary indicator and thus suggests that the market will soon take a different direction.
Since its inception in 1990, the VIX monthly average was roughly 19%. In March 2022, however, the VIX averaged 27%. This is relevant because subsequent three-year average annualized returns following months where the VIX averaged more than 25% were 14.1% for the Russell 2000 and 9.4% for the Russell 1000. Moreover, small-cap beat large-cap in 83% of these three-year periods—which is a very impressive batting average. This trend underscores our long-term optimism for both absolute and relative small-cap returns.
Three-Year Returns Following Highly Volatile Markets
Subsequent Monthly Rolling Average Annualized Three-Year Performance for the Russell 2000 in Monthly Rolling CBOE S&P 500 Volatility Index (VIX) Return Ranges
From 12/31/89 to 3/31/22
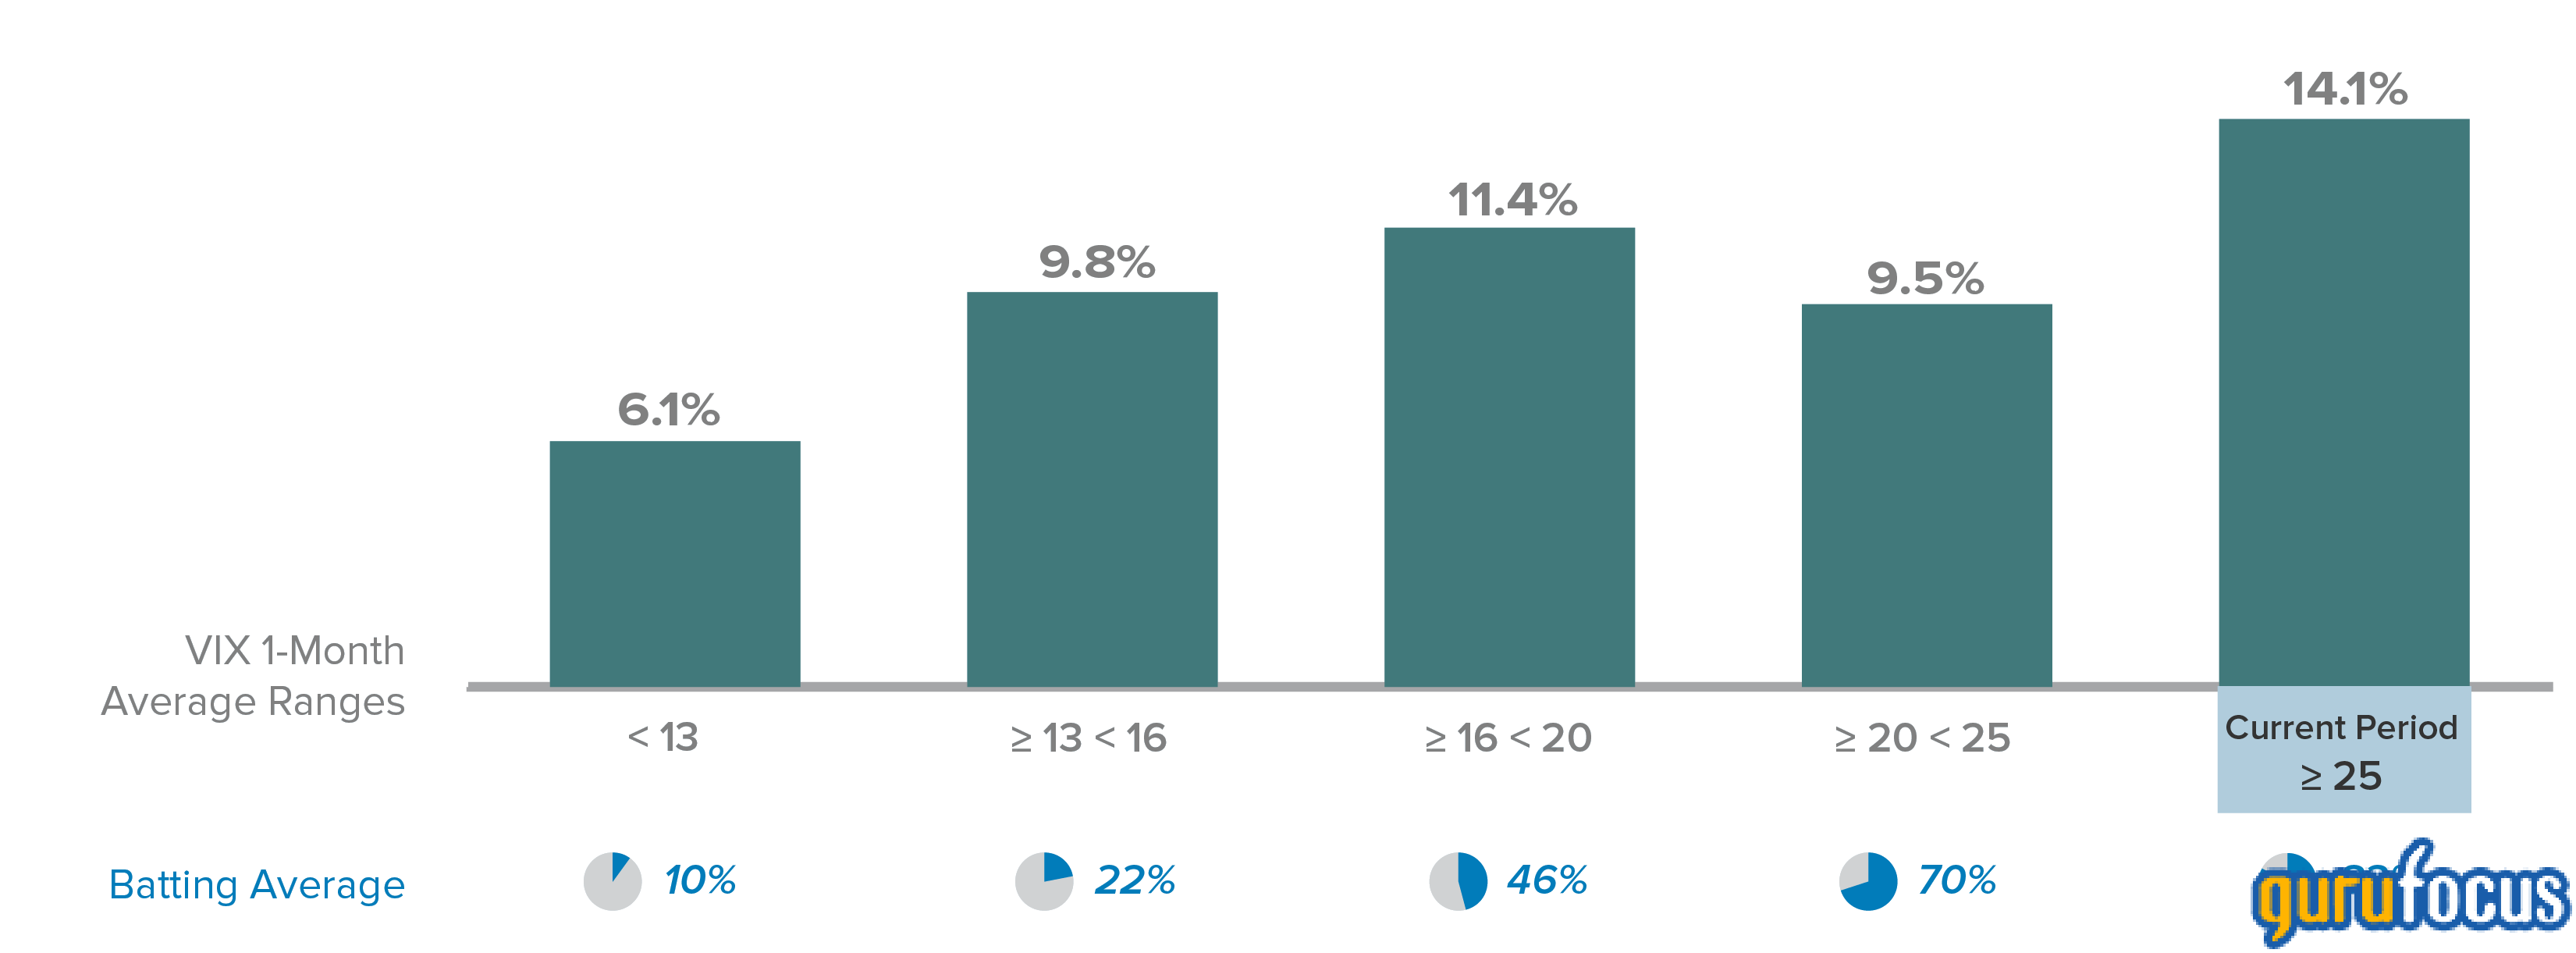
Past performance is no guarantee of future results. ‘Batting Average’ refers to the percentage of 3-year periods in which the Russell 2000 Index outperformed the Russell 1000 Index. Source: Bloomberg.
Our Outlook
As the Fed continues to both hike rates and to pivot from quantitative easing to quantitative tightening, stocks that previously benefited most from abundant liquidity are going to continue to be among the hardest hit—and based on the early effects of the Fed’s moves, these are mostly small-cap growth stocks. Equally, if not more important, despite the lead that the Russell 2000 Value has been building over the Russell 2000 Growth since 4Q20, the former remains near its lowest valuation vis-à-vis the latter in 20 years.
Small-Cap Value Sells at Near Its Lowest Valuation to Growth in 20 Years
Russell 2000 Value and Growth Shifted Median Relative LTM EV/EBIT1 Russell 2000 Value/Growth
From 3/31/00 to 3/31/22
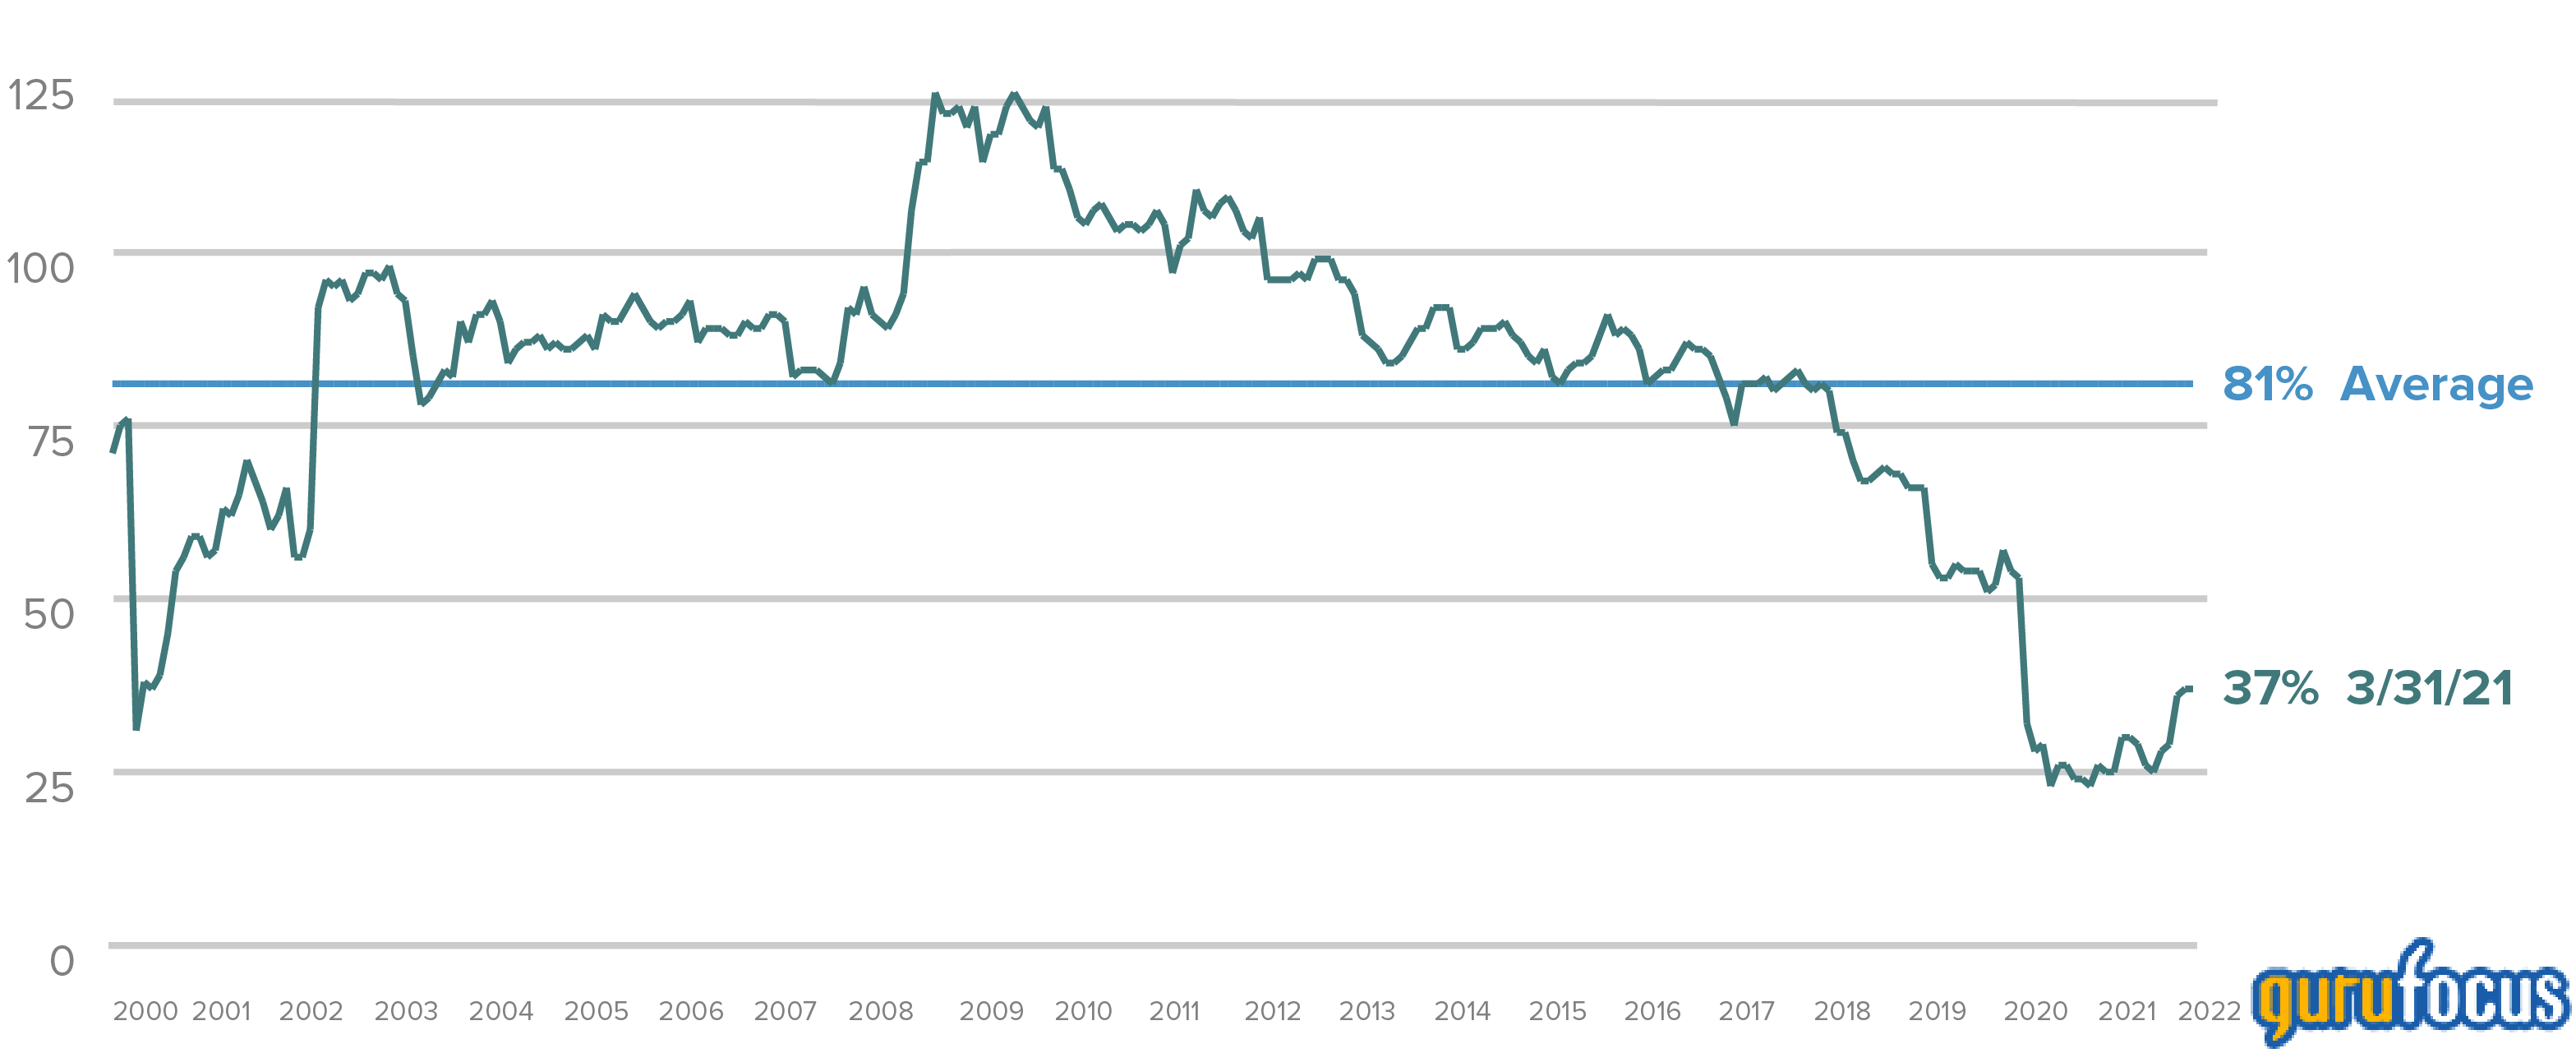
1 Last twelve months enterprise value/earnings before interest and taxes.
Past performance is no guarantee of future results. Source: FactSet
We continue to believe that earnings will ultimately drive small-cap returns. As inflation and rising rates continue to affect companies in differentiated ways, we see the most promising earnings prospects for B2B enterprises—those that continue to see robust order books and increasing demand as opposed to more consumer-facing companies that face challenges in the form of persistent inflation and rising energy prices that may crimp consumer spending. Based on these observations, we believe that active management—which also has a strong record of outperformance in value-led market cycles—will become increasingly important through our currently difficult and uncertain period. While cognizant that near-term returns may be more muted, we also see many opportunities across sectors and industries as we seek to use volatility to find attractively priced, fundamentally strong companies that we suspect will drive results over the next three to five years.
Important Disclosure Information
The thoughts concerning recent market movements and future prospects for small-company stocks are solely those of Royce Investment Partners, and, of course, there can be no assurances with respect to future small-cap market performance. Past performance is no guarantee of future results. Historical market trends are not necessarily indicative of future market movements.
This material is not authorized for distribution unless preceded or accompanied by a current prospectus. Please read the prospectus carefully before investing or sending money. The performance data and trends outlined in this article are presented for illustrative purposes only. Past performance is no guarantee of future results. Historical market trends are not necessarily indicative of future market movements. Investments in securities of micro-cap, small-cap, and/or mid-cap companies may involve considerably more risk than investments in securities of larger-cap companies. (Please see "Primary Risks for Fund Investors" in the prospectus.) Investments in foreign companies may be subject to different risks than investments in securities of U.S. companies, including adverse political, social, economic, or other developments that are unique to a particular country or region. (Please see "Investing in International Securities" in the prospectus.)