

In a 13F filing for the first quarter, Warren Buffett (Trades, Portfolio) revealed his conglomerate, Berkshire Hathaway (BRK.A, Financial)(BRK.B, Financial), entered a new holding in Citigroup Inc. (C, Financial).
The guru investor bought 55.15 million shares of the financial company. Much has been written about the stock and, since then, the multiples of some U.S. banks have decreased even further. This discussion will highlight the notion of value and margin of safety pertaining to Citigroup and will provide comparative analysis of the value that the bank and its peer group offer currently.
Citigroup is neither a traditional nor pure investment bank, but rather a complex diversified global business, meaning it is not easy to define its peer group. But the companies listed below seem relevant in terms of business model, size and exposure.
Asset structure of bank peer group, % of total assets on balance sheet
| Citigroup | Bank of America (BAC, Financial) | JPMorgan Chase (JPM, Financial) | Wells Fargo* (WFC, Financial) | |
| Cash and cash equivalents | 11% | 9% | 19% | 10% |
| Money Market Investments | 14% | 9% | 8% | 3% |
| Net Loan | 27% | 30% | 27% | 47% |
| Securities & Investments | 30% | 36% | 27% | 31% |
| Total Receivables | 4% | 3% | 4% | 2% |
| Property, Plant and Equipment | 0% | 0% | 1% | 1% |
| Intangible Assets | 1% | 2% | 1% | 2% |
| Other Assets for Banks | 13% | 10% | 14% | 4% |
| Total | 100% | 100% | 100% | 100% |
*Wells Fargo seems to be less relevant as a peer, while JPMorgan is more relevant due to the nature of services provided.
The table above shows the asset composition of the selected banks. The asset structure among banks are very close to one another, practically identical. Citigroup differs in money market investments, which are slightly higher and substitute for net loan’s share of the balance when compared to Bank of America.
It is widely known that the assets of banks are traded. As such, they are priced accordingly, meaning the valuation approach for these assets are identical and there are few discrepancies on how each bank prices assets on the balance sheet. Given that the structures of these balance sheets very much resemble each other, I conclude the difference in market pricing of the banks' own equity (i.e., different price-book ratios) is due to either the quality of some of the assets or operational efficiencies of the bank that drive the return on assets higher for some banks, but not for the others (given there is no excessive leverage). The main question for a defensive value investor in such a situation would be, as always, “Do I get more than I pay for?”
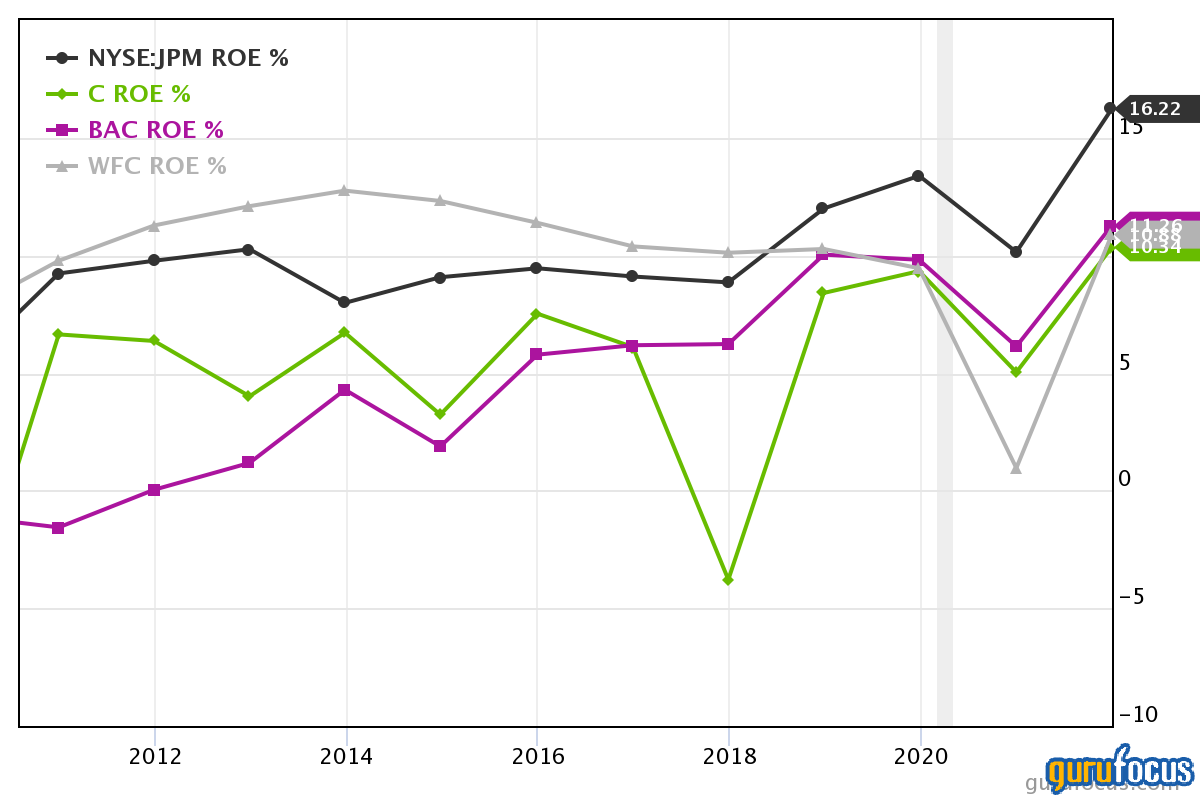
Return on equity and price-book ratio
Citigroup is one of the worst performers based on return on equity. I would assume the ROE for the leader of the group, JPMorgan, to be around 12%, while it is around 8% for Citigroup.
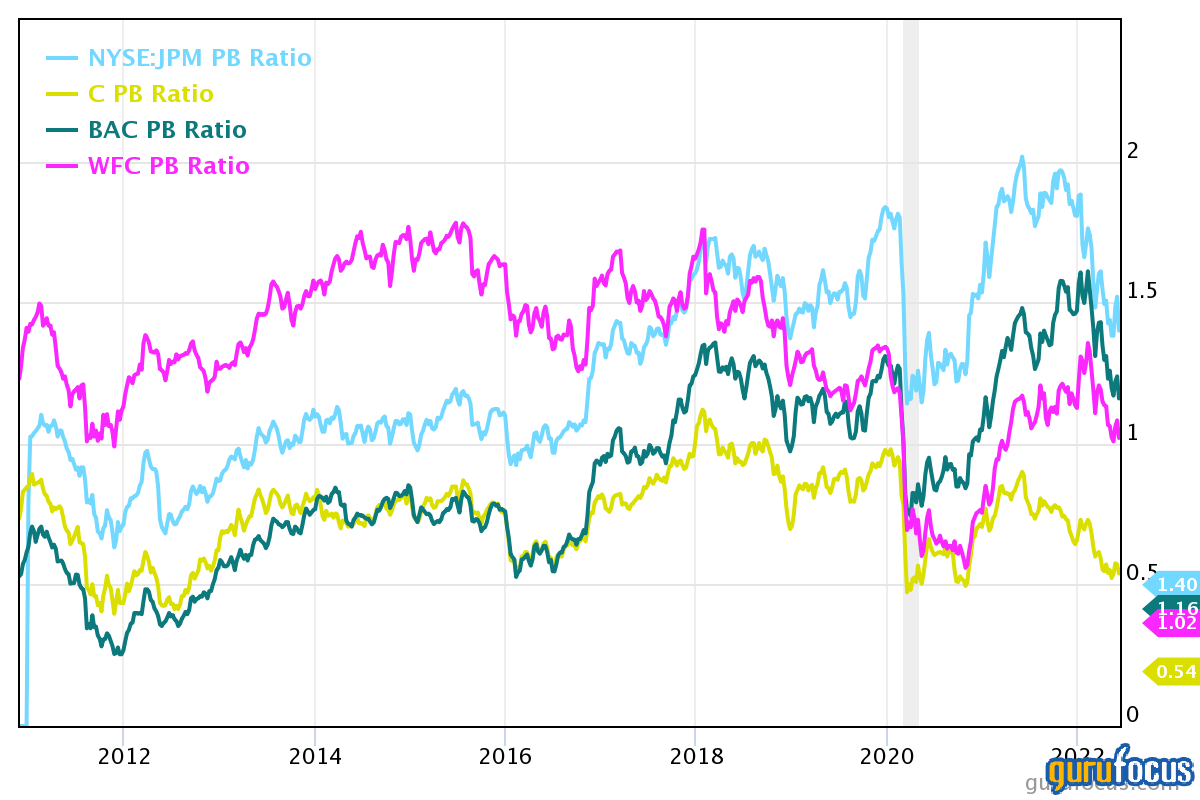
The market price of equity, or price-book ratio, is illustrated below. The market currently prices each dollar of the equity of Citigroup (0.5 dollars per dollar of book equity) almost 3 times cheaper than that of JPMorgan ($1.50 per dollar of book equity). Does making 1.5 times higher ROE justify 3 times difference in pricing? This rhetorical question leads me to draw a picture of the adequate assessment of value that I would get as a defensive investor.
As noted in Peter Bevelin's book, “Seeking Wisdom: From Darwin to Munger,” Charlie Munger (Trades, Portfolio) stressed the importance of avoiding the mental trap of basing your judgment solely on comparison. As a defensive investor, I will try to assign the value to each dollar of the equity of Citigroup and its peers on their own, irrespective of comparative valuation.
A discounted cash flow model, discounted at 10%, would yield the following results for each dollar of book equity of each bank:
| Annual yield (ROE) | Fair price by DCF | Actual market price as a PB ratio | Margin of safety | |
| C | 8 cents per dollar of equity and 5% growth rate | 1 | 0.5 | 50% |
| JPM | 12 cents per dollar of equity and 11.7% growth rate | 2.35 | 1.5 | 36.17% |
| BAC | 9 cents per dollar of equity and 15% growth rate | 2.2 | 1.2 | 45.45% |
Even though Citigroup is the underdog based on these performance indicators, it still has the highest margin of safety among its peers. As such, I believe the rationale behind Buffett's purchase is explained by the concept of margin of safety.
Also check out: