

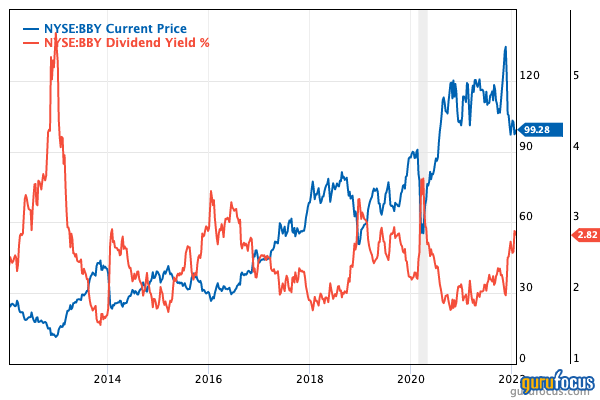
At the end of 2012, shares of Best Buy Company Inc. (BBY, Financial) were trading at around the $12 mark. From there, they began climbing rapidly, reaching $127 per share in November 2021. That’s what legendary mutual fund manager Peter Lynch would call a 10-bagger—and in less than 10 years.
Since late in 2021, though, the share price has declined precipitously, reaching $72.14 at the close of trading on June 27. The broader market decline opens up several opportunities for investors who expect the stock market will escape its slump sooner or later, and I believe Best Buy is one of the more attractive names on the market right now.
About Best Buy
The U.S-based international electronics chain operates 1,144 retail stores covering 41.31 million square feet. For the quarter ended April 30, its merchandise revenue came in five major streams:
- Computing and mobile phones: 43%
- Consumer electronics: 29%
- Appliances: 16%
- Entertainment: 6%
It also has a minor segment titled Other, which brought in 1% of revenue.
For fiscal year 2023, which will end on the last Saturday of January next year, the company expects revenue of $49.9 billion.
Competition
In its 10-K for fiscal 2022, Best Buy reported competition from several types of businesses: “Our competitors are primarily multi-channel retailers, e-commerce businesses, technology service providers, traditional store-based retailers, vendors and mobile network carriers who offer their products and services directly to customers.”
Among those competitors are three fierce retailers that sell electronics along with other products: Amazon.com (AMZN, Financial), Walmart (WMT, Financial) and Costco (COST, Financial).
Best Buy believes it has several competitive advantages, including staff knowledge that allows them to connect technology products and solutions with customer needs.
It also references its price monitoring expertise, efficient operations, economies of scale, broad and curated product assortment, strong vendor partnerships and its ability to showcase technology.
It has also introduced a loyalty or membership program called Best Buy Totaltech. The program offers enhanced support, free delivery and standard installations as well as product protection. In the short-term, it increases costs and puts pressure on margins. In the long-term, it should generate higher customer lifetime value and market share.
Financial strength
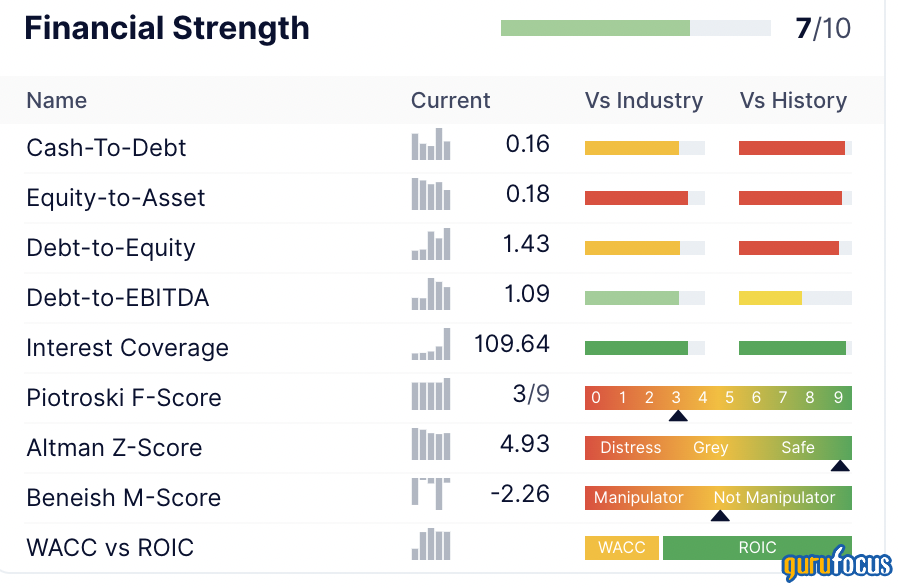
At the end of the first quarter, the balance sheet showed the following:
- Cash and cash equivalents (no marketable securities): $640 million
- Short-term debt: $15 million
- Long-term debt: $1.17 billion
- Long-term capital lease obligations: $2.121 billion.
On the table, note that the interest coverage ratio is over 100 despite cash being rather low compared to debt. The company is also a value creator, with a return on invested capital (ROIC) that is larger than its weighted average cost of capital (WACC).
Profitability

Best Buy receives its strong profitability ranking from its various return ratios, not its margins. The latter are roughly at par with peers and competitors in the retail-cyclical industry.
According to the first quarter 2023 earnings release, the gross margin slipped in the first quarter for three reasons:
“Domestic gross profit rate was 21.9% versus 23.3% last year. The lower gross profit rate was primarily due to: (1) lower services margin rates, including pressure associated with the Best Buy Totaltech membership offering; (2) lower product margin rates, including increased promotions; and (3) higher supply chain costs.”
Growth

Consumer demand for electronics continues to grow, and Best Buy has grown with it. This 10-year chart shows how earnings per share without non-recurring items has grown vigorously while revenue and Ebitda have been relatively flat:

Dividends and share buybacks
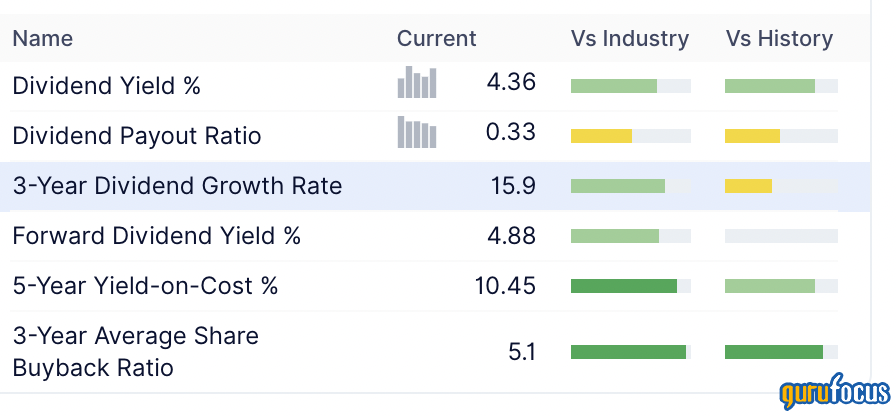
The highlight in the dividend and share buybacks table is the size of the dividend yield, due in part to the depressed share price:
Of course, it helps that the company has increased the dividend every year since 2013:

It’s also delivered extra value to shareholders in most of the past 10 years, reducing the number of outstanding shares by an average of nearly 4% per year.
Valuation

GuruFocus gives Best Buy a high ranking for value, and that’s mainly a function of the extensive share price decline that's occurred in recent months. The GF Value chart shows a possible value trap:
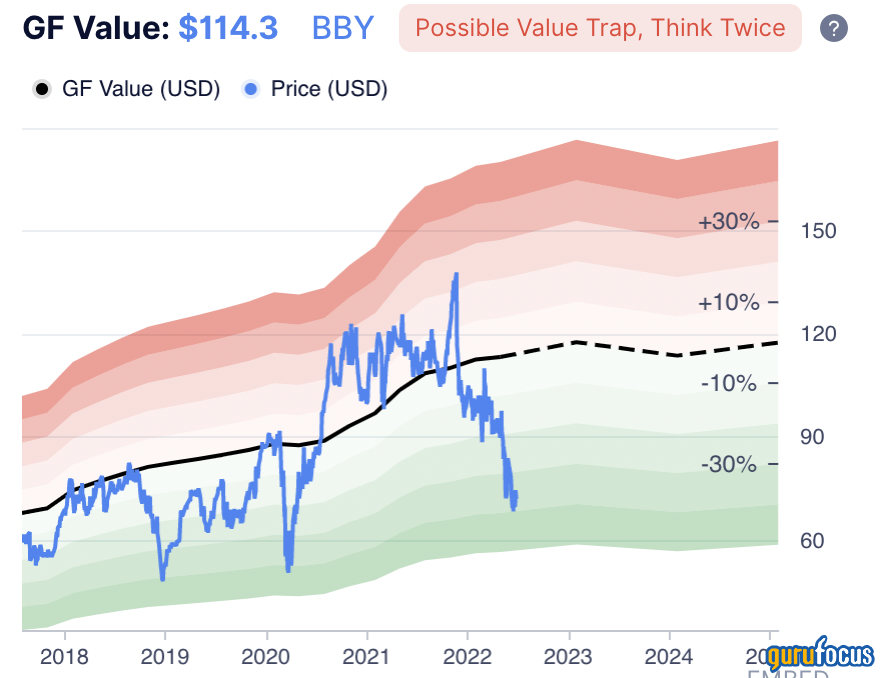
But it’s only the share price that’s down, so I don't think this stock is a value trap. Best Buy is doing well with growth. As for the share price, it’s been pulled down by the broader market’s concern about supply chains, interest rates, the Ukraine war and more.
We also saw that it has $640 million in cash and cash equivalents, and that its interest coverage ratio is very high. The company obviously has no concerns about bankruptcy; it has a high Altman Z-Score and it distributed $654 million to shareholders through share repurchases ($455 million) and dividends ($199 million).
The price-earnings ratio sits well below that of its peers and competitors in the retail-cyclical industry at 7.99 versus the industry’s median of 15.21. Based on the five-year Ebitda growth rate of 14.50%, the PEG ratio is 0.55, signaling undervaluation.
Best Buy has a GF Score of 88 out of 100. A historical study from GuruFocus found that higher GF Scores correlate with better stock performance. On that basis, we could expect Best Buy to do well in the coming years:

Gurus
Best Buy was owned by just two gurus at the end of March 2022:
- Jeremy Grantham (Trades, Portfolio) of GMO LLC held 277,600 shares, an increase of 31.56% since Dec. 31, 2021. His stake represented 0.12% of the company’s shares outstanding and 0.12% of GMO’s assets under management.
- Joel Greenblatt (Trades, Portfolio) of Gotham Asset Management reduced his holding by 5.69% to 24,745 shares.
While few gurus own the name and they are small holdings, Best Buy does have a heavy contingent of institutional investors. According to the GuruFocus ownership page, the institutional funds own 89.41% of shares outstanding.
Insiders own another 2.29%, led by CEO Corie Barry, who held 276,193 shares as of March 22.
Conclusion
Best Buy is one of many companies that has seen its share price slump in the market selloff, despite having excellent fundamentals. This means an opportunity has appeared for bargain hunters to pick up shares at a discount (at least compared to prices last year). It also provides an opportunity for dividend investors to shortlist a relatively high dividend.
Also check out:- Joel Greenblatt Undervalued Stocks
- Joel Greenblatt Top Growth Companies
- Joel Greenblatt High Yield stocks, and
- Stocks that Joel Greenblatt keeps buying
- Jeremy Grantham Undervalued Stocks
- Jeremy Grantham Top Growth Companies
- Jeremy Grantham High Yield stocks, and
- Stocks that Jeremy Grantham keeps buying