

Fashion and performance shoemaker Deckers Outdoor Corporation (DECK, Financial) had good news to share with investors in its first quarter fiscal 2023 earnings report last month. Not only did the HOKA brand reach over $1 billion in net sales, but its overall sales increased nearly 22% and the board of directors authorized more than $1 billion in share repurchases.
About Deckers
Deckers is a shoe company, or in its own words from the latest 10-K, “We are a global leader in designing, marketing, and distributing innovative footwear, apparel, and accessories developed for both everyday casual lifestyle use and high-performance activities.” It owns five brands which correspond to its five main operating segments: UGG, Koolaburra, HOKA, Teva and sgnuk.
The company also has a sixth segment, direct-to-consumer, which is its e-commerce channel. E-commerce is becoming an increasingly important part of the business:
“We have observed a meaningful shift in the way consumers shop for products and make purchasing decisions, evidenced by decreases in consumer retail store activity as consumers accelerate their migration to online shopping. We have optimized our digital marketing strategy to capitalize on these trends, which has accelerated global online consumer acquisition and retention rates. Although we continue to see consumers migrate to online shopping, our DTC online and retail sales channels interact with each other and largely overlap to provide a fluid purchasing experience, which engenders brand loyalty while increasing product sales and improving our inventory productivity.”
Earnings and outlook
For full fiscal 2022, which ended on March 31, the company reported the following results:
- Wholesale net sales were $1.937 billion, a year-over-year increase of 31.0%.
- DTC net sales totaled $1.214 billion, an increase of 13.8% (it added that it was not reporting comparable DTC sales for fiscal 2022 because of ‘meaningful’ disruption of its retail store base).
- Domestic net sales of $2.168 billion, up 23.1%.
- International net sales of $982.5 million, an increase of 25.3%.
Looking ahead to the rest of fiscal 2023, the company expected diluted earnings per share in the range of $17.40 to $18.25. That would be an increase from the $16.26 per share last fiscal year even at the low end.
Competition
Deckers reported that its industry is highly competitive. Competitors are mainly athletic and other footwear companies, branded apparel firms and retailers that have their own private labels.
The GuruFocus system compares it with the likes of Skechers USA Inc. (SKX, Financial) and Crocs Inc. (CROX, Financial).
In recent years, competition has increased because of offshore manufacturing, e-commerce and low barriers to entry.
How does the company keep up with or get ahead of the competition? It noted in the 10-K, “We believe that our ability to successfully compete depends on numerous factors, including our ability to predict, assess, and respond quickly to changing consumer tastes and preferences, produce appealing products that meet expectations for product quality and technical performance, maintain and enhance the image and strength of our brands, price our products competitively, and weather the impacts and disruptions caused by the pandemic, among others.”
Those competitive advantages have helped Deckers outperform both the S&P 500 Apparel, Accessories Luxury Goods Index and the NYSE Composite index over the past half-decade:

Financial strength

Deckers’ debt load is relatively light, given the ratios we see in the above chart. That’s especially true of the interest coverage ratio, which is an excellent 249.76. Here’s an overview of the cash and debt situation:

What might concern investors about the financial strength table is the negative Beneish M-Score. At -1.55, the Beneish M-Score indicates the possibility that a company could be manipulating its earnings.
Should we be concerned? Perhaps, but personally, I'm not too concerned about it because, just like any other calculation, it could be the result not of earnings manipulation but of an unusual reporting structure. One would need to look closely at the calculation to determine why it is negative and if it is a cause for concern.
Profitability

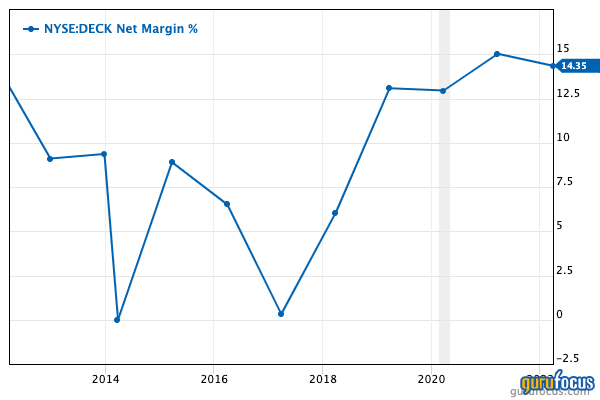
As the profitability table indicates, Deckers has industry-leading metrics for profitability. For example, its net margin exceeds 85.85% of the 1,046 companies in the manufacturing - apparel and accessories industry.
As the following chart shows, the company put racing shoes on its net margin in 2018 and 2019:
Growth

Deckers gets a top score for growth, with industry-leading revenue growth. While it hasn’t done quite as well beating its competitors in turning revenue into Ebitda and earnings, the three-year EPS without NRI growth rate is still excellent at 22.5% per year.
Free cash flow over the past three years appears more disappointing. Over the past 10 years, we see something of a seesaw:

Dividends and share repurchases
Deckers does not pay a dividend, but has rewarded shareholders with share buybacks:

The board of directors recently increased its repurchase authorization by $1.2 billion, bring the current total to $1.5 billion.
Valuation

Deckers receives a middling rank for value. The GF Value chart rates the stock as fairly valued:

The company also has a middling price-earnings ratio of 20.52, which is average for the industry.
However, couple the price-earnings ratio with an Ebitda growth rate of 55.19% per year over the past five years and we get a PEG ratio of 0.37, which is well below the fair value point of 1.00.
Deckers gets a GF Score of 89 out of 100, with high ranks for growth, profitability and financial strength, a mediocre GF Value rank and a low momentum rank.

Gurus
Eight of the Premium gurus followed by GuruFocus had positions in Deckers as of their latest quarterly reports, including:
- Steven Scruggs (Trades, Portfolio) of the FPA Queens Road Small Cap Value Fund held 27,860 shares as of May 31. That represented 0.10% of Deckers’ shares outstanding and 1.76% of the fund’s reported common stock portfolio.
- Jim Simons (Trades, Portfolio) of Renaissance Technologies held 15,600 shares as of the firm's latest 13F on March 31. This was a new holding for the firm.
- Paul Tudor Jones (Trades, Portfolio) of Tudor Investment Corp. cut his firm's position by 6.18% in the first quarter and finished with 12,280 shares.
Institutional investors hold 91.09% of available shares, while insiders own 7.60%. Among the direct holders, President and CEO David Powers had the biggest stake with 74,333 shares.
Conclusion
Profitable growth is one of the key messages that emerges from my analysis of Deckers’ fundamentals. It has boosted its revenue significantly in recent years, and at the same time has converted that growth into even higher growth of Ebitda and EPS.
Judging by the price chart and growth measures, the company looks either fairly valued or undervalued. Value investors who can live with a small amount of debt and little margin of safety may be interested in Deckers. The same holds for growth investors who see the current uptrend as sustainable. But for income investors, there is nothing here.
Also check out:- Steven Scruggs Undervalued Stocks
- Steven Scruggs Top Growth Companies
- Steven Scruggs High Yield stocks, and
- Stocks that Steven Scruggs keeps buying
- Paul Tudor Jones Undervalued Stocks
- Paul Tudor Jones Top Growth Companies
- Paul Tudor Jones High Yield stocks, and
- Stocks that Paul Tudor Jones keeps buying