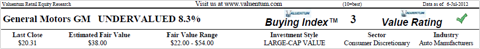
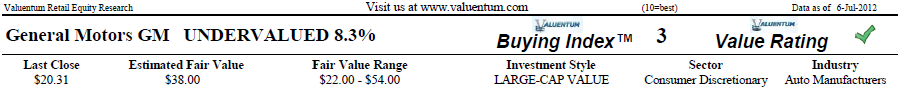
As part of our process, we perform a rigorous discounted cash-flow methodology that dives into the true intrinsic worth of companies. In General Motors' (GM, Financial) case, we think the firm is undervalued. We think it is fairly valued at $38 per share.
For some background, we think a comprehensive analysis of a firm's discounted cash-flow valuation and relative valuation versus industry peers is the best way to identify the most attractive stocks at the best time to buy. This process culminates in what we call our Valuentum Buying Index (click here for an in-depth presentation about our methodology), which ranks stocks on a scale from 1 to 10, with 10 being the best. Essentially, we're looking for firms that overlap investment methodologies, thereby revealing the greatest interest by investors (we like firms that fall in the center of the diagram below):
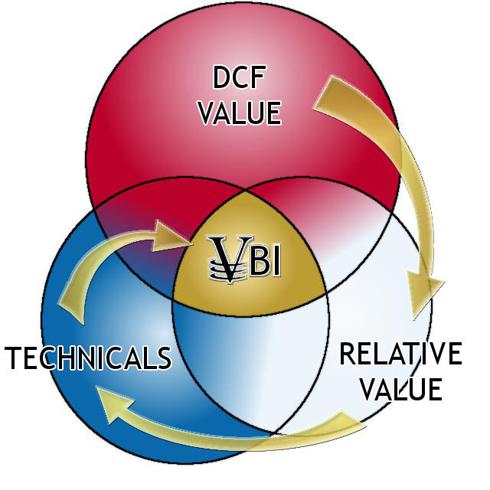
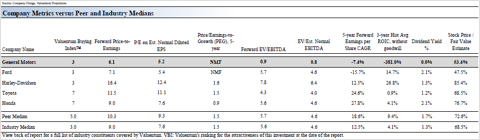
If a company is undervalued both on a DCF and on a relative valuation basis and is showing improvement in technical and momentum indicators, it scores high on our scale. General Motors posts a VBI score of 3 on our scale, reflecting our 'undervalued' DCF assessment of the firm and its neutral relative valuation versus peers. We compare General Motors to peers Ford (F, Financial), Harley Davidson (HOG), Toyota (TM), and Honda (HMC).
Our Report on General Motors
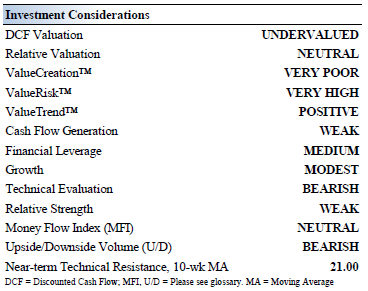
Investment Considerations
Investment Highlights
• General Motors' average return on invested capital has trailed its cost of capital during the past few years, indicating weakness in business fundamentals and an inability to earn economic profits through the course of the economic cycle. We think there are better quality firms out there.
• Although we think the firm's DCF valuation indicates a potential attractive investment opportunity, we'd be more comfortable investing in the firm if it was more attractively priced on a relative basis versus
peers as well.
• General Motors' cash flow generation is below what we'd expect from an average company in our coverage universe, and the firm's financial leverage is somewhat elevated. If cash flows continue to be weak, we'd grow more cautious on the firm's overall financial health.
• The firm posts a VBI score of 3. We don't find the firm that attractive based on this measure, and we'd grow more constructive if it registered an 8 or higher on our scale.
Business Quality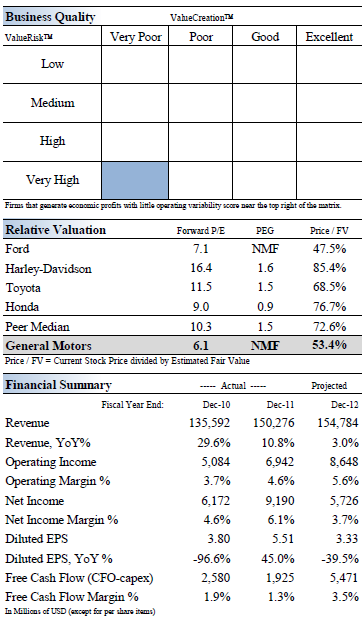
Economic Profit Analysis
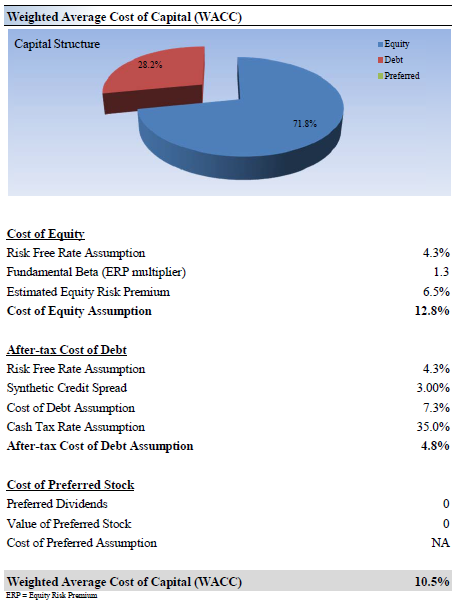
The best measure of a firm's ability to create value for shareholders is expressed by comparing its return on invested capital (ROIC) with its weighted average cost of capital (WACC). The gap or difference between ROIC and WACC is called the firm's economic profit spread. General Motors' 3-year historical return on invested capital (without goodwill) is -381%, which is well below the estimate of its cost of capital of 10.5%. As such, we assign the firm a ValueCreation™ rating of VERY POOR.
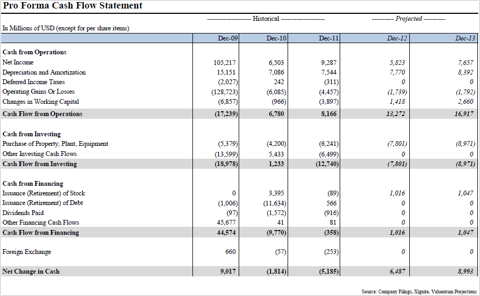
Cash Flow Analysis
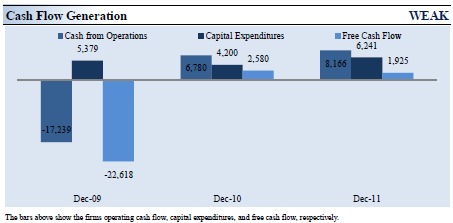
Firms that generate a free cash flow margin (free cash flow divided by total revenue) above 5% are usually considered cash cows. General Motors' free cash flow margin has averaged about -6.1% during the past 3 years. As such, we think the firm's cash flow generation is relatively WEAK. The free cash flow measure shown above is derived by taking cash flow from operations less capital expenditures and differs from enterprise free cash flow (FCFF), which we use in deriving our fair value estimate for the company. For more information on the differences between these two measures, please visit our website at www.valuentum.com. At General Motors, cash flow from operations moved into positive territory from levels two years ago, as capital expenditures expanded about 16% during this time period.
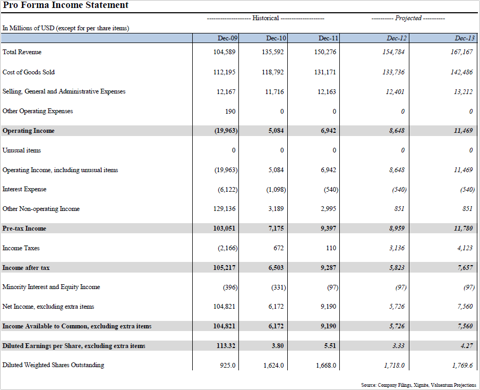
Valuation Analysis
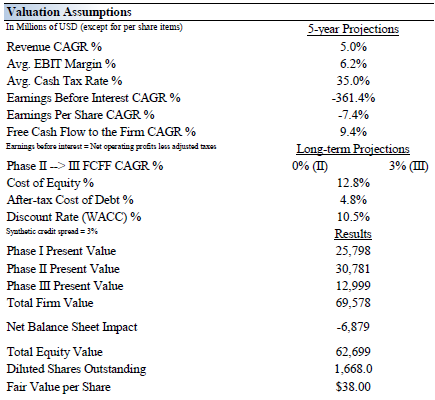
Our discounted cash flow model indicates that General Motors's shares are worth between $22.00 - $54.00 each. The margin of safety around our fair value estimate is driven by the firm's VERY HIGH ValueRisk™ rating, which is derived from the historical volatility of key valuation drivers. The estimated fair value of $38 per share represents a price-to-earnings (P/E) ratio of about 6.9 times last year's earnings and an implied EV/EBITDA multiple of about 4.8 times last year's EBITDA. Our model reflects a compound annual revenue growth rate of 5% during the next five years, a pace that is higher than the firm's 3-year historical compound annual growth rate of 0.3%. Our model reflects a 5-year projected average operating margin of 6.2%, which is above General Motors's trailing 3-year average. Beyond year 5, we assume free cash flow will grow at an annual rate of 0% for the next 15 years and 3% in perpetuity. For General Motors, we use a 10.5% weighted average cost of capital to discount future free cash flows.
Margin of Safety Analysis
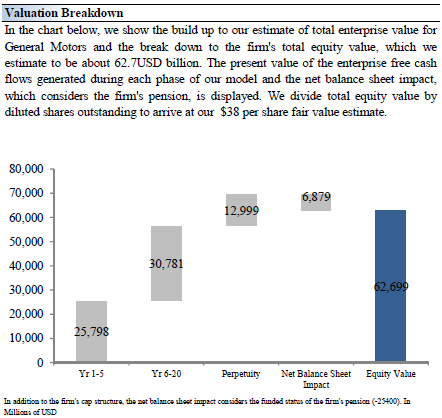
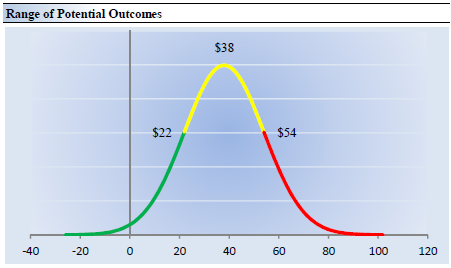
Our discounted cash flow process values each firm on the basis of the present value of all future free cash flows. Although we estimate the firm's fair value at about $38 per share, every company has a range of probable fair values that's created by the uncertainty of key valuation drivers (like future revenue or earnings, for example). After all, if the future was known with certainty, we wouldn't see much volatility in the markets as stocks would trade precisely at their known fair values. Our ValueRisk™ rating sets the margin of safety or the fair value range we assign to each stock. In the graph below, we show this probable range of fair values for General Motors. We think the firm is attractive below $22 per share (the green line), but quite expensive above $54 per share (the red line). The prices that fall along the yellow line, which includes our fair value estimate, represent a reasonable valuation for the firm, in our opinion.
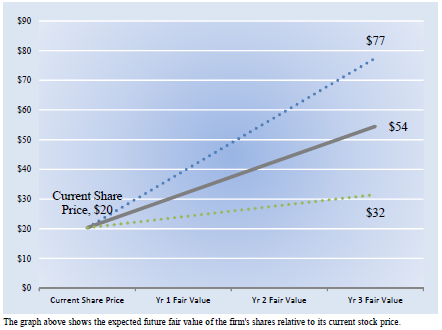
Future Path of Fair Value
We estimate General Motors's fair value at this point in time to be about $38 per share. As time passes, however, companies generate cash flow and pay out cash to shareholders in the form of dividends. The chart below compares the firm's current share price with the path of General Motors's expected equity value per share over the next three years, assuming our long-term projections prove accurate. The range between the resulting downside fair value and upside fair value in Year 3 represents our best estimate of the value of the firm's shares three years hence. This range of potential outcomes is also subject to change over time, should our views on the firm's future cash flow potential change. The expected fair value of $54 per share in Year 3 represents our existing fair value per share of $38 increased at an annual rate of the firm's cost of equity less its dividend yield. The upside and downside ranges are derived in the same way, but from the upper and lower bounds of our fair value estimate range.
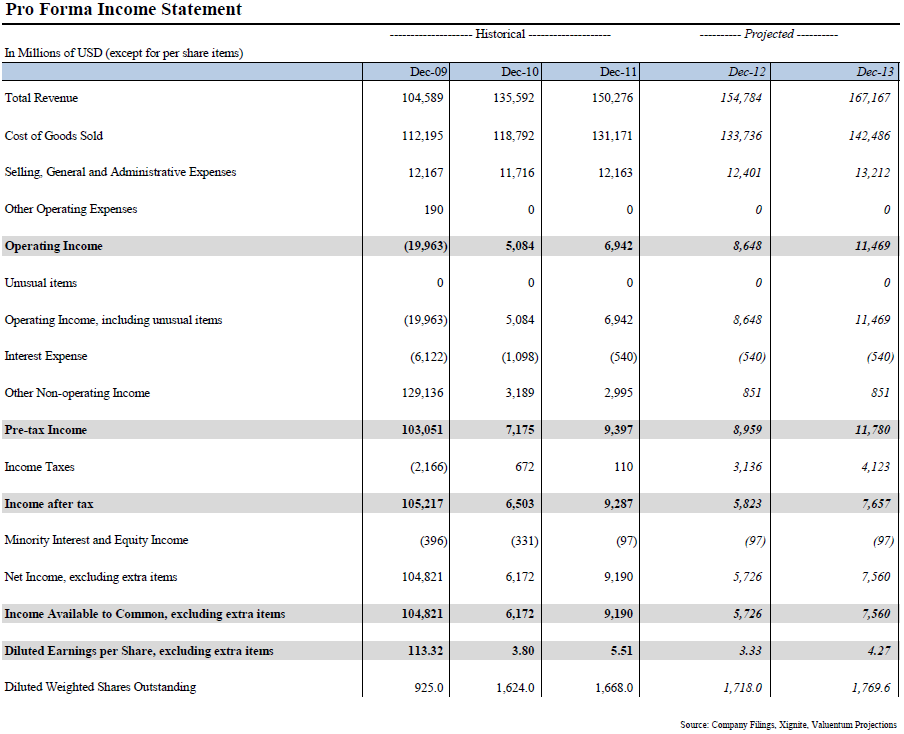
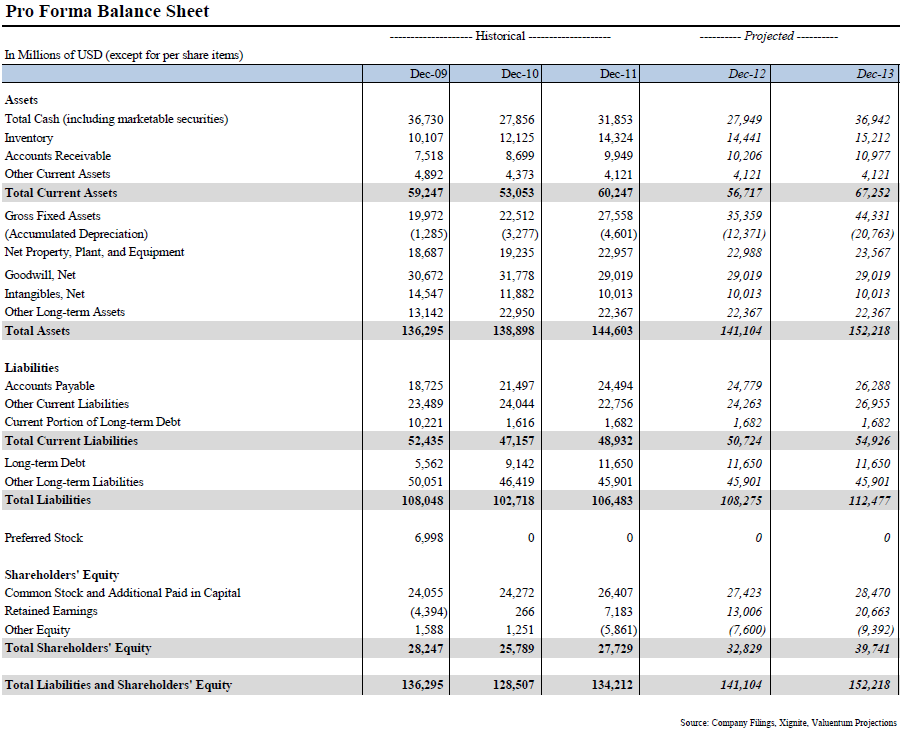
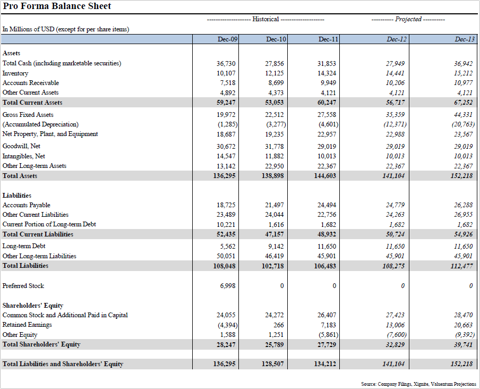
Pro Forma Financial Statements
For some background, we think a comprehensive analysis of a firm's discounted cash-flow valuation and relative valuation versus industry peers is the best way to identify the most attractive stocks at the best time to buy. This process culminates in what we call our Valuentum Buying Index (click here for an in-depth presentation about our methodology), which ranks stocks on a scale from 1 to 10, with 10 being the best. Essentially, we're looking for firms that overlap investment methodologies, thereby revealing the greatest interest by investors (we like firms that fall in the center of the diagram below):

If a company is undervalued both on a DCF and on a relative valuation basis and is showing improvement in technical and momentum indicators, it scores high on our scale. General Motors posts a VBI score of 3 on our scale, reflecting our 'undervalued' DCF assessment of the firm and its neutral relative valuation versus peers. We compare General Motors to peers Ford (F, Financial), Harley Davidson (HOG), Toyota (TM), and Honda (HMC).
Our Report on General Motors
Investment Considerations
Investment Highlights
• General Motors' average return on invested capital has trailed its cost of capital during the past few years, indicating weakness in business fundamentals and an inability to earn economic profits through the course of the economic cycle. We think there are better quality firms out there.
• Although we think the firm's DCF valuation indicates a potential attractive investment opportunity, we'd be more comfortable investing in the firm if it was more attractively priced on a relative basis versus
peers as well.
• General Motors' cash flow generation is below what we'd expect from an average company in our coverage universe, and the firm's financial leverage is somewhat elevated. If cash flows continue to be weak, we'd grow more cautious on the firm's overall financial health.
• The firm posts a VBI score of 3. We don't find the firm that attractive based on this measure, and we'd grow more constructive if it registered an 8 or higher on our scale.
Business Quality
Economic Profit Analysis
The best measure of a firm's ability to create value for shareholders is expressed by comparing its return on invested capital (ROIC) with its weighted average cost of capital (WACC). The gap or difference between ROIC and WACC is called the firm's economic profit spread. General Motors' 3-year historical return on invested capital (without goodwill) is -381%, which is well below the estimate of its cost of capital of 10.5%. As such, we assign the firm a ValueCreation™ rating of VERY POOR.
Cash Flow Analysis
Firms that generate a free cash flow margin (free cash flow divided by total revenue) above 5% are usually considered cash cows. General Motors' free cash flow margin has averaged about -6.1% during the past 3 years. As such, we think the firm's cash flow generation is relatively WEAK. The free cash flow measure shown above is derived by taking cash flow from operations less capital expenditures and differs from enterprise free cash flow (FCFF), which we use in deriving our fair value estimate for the company. For more information on the differences between these two measures, please visit our website at www.valuentum.com. At General Motors, cash flow from operations moved into positive territory from levels two years ago, as capital expenditures expanded about 16% during this time period.
Valuation Analysis
Our discounted cash flow model indicates that General Motors's shares are worth between $22.00 - $54.00 each. The margin of safety around our fair value estimate is driven by the firm's VERY HIGH ValueRisk™ rating, which is derived from the historical volatility of key valuation drivers. The estimated fair value of $38 per share represents a price-to-earnings (P/E) ratio of about 6.9 times last year's earnings and an implied EV/EBITDA multiple of about 4.8 times last year's EBITDA. Our model reflects a compound annual revenue growth rate of 5% during the next five years, a pace that is higher than the firm's 3-year historical compound annual growth rate of 0.3%. Our model reflects a 5-year projected average operating margin of 6.2%, which is above General Motors's trailing 3-year average. Beyond year 5, we assume free cash flow will grow at an annual rate of 0% for the next 15 years and 3% in perpetuity. For General Motors, we use a 10.5% weighted average cost of capital to discount future free cash flows.

Margin of Safety Analysis
Our discounted cash flow process values each firm on the basis of the present value of all future free cash flows. Although we estimate the firm's fair value at about $38 per share, every company has a range of probable fair values that's created by the uncertainty of key valuation drivers (like future revenue or earnings, for example). After all, if the future was known with certainty, we wouldn't see much volatility in the markets as stocks would trade precisely at their known fair values. Our ValueRisk™ rating sets the margin of safety or the fair value range we assign to each stock. In the graph below, we show this probable range of fair values for General Motors. We think the firm is attractive below $22 per share (the green line), but quite expensive above $54 per share (the red line). The prices that fall along the yellow line, which includes our fair value estimate, represent a reasonable valuation for the firm, in our opinion.
Future Path of Fair Value
We estimate General Motors's fair value at this point in time to be about $38 per share. As time passes, however, companies generate cash flow and pay out cash to shareholders in the form of dividends. The chart below compares the firm's current share price with the path of General Motors's expected equity value per share over the next three years, assuming our long-term projections prove accurate. The range between the resulting downside fair value and upside fair value in Year 3 represents our best estimate of the value of the firm's shares three years hence. This range of potential outcomes is also subject to change over time, should our views on the firm's future cash flow potential change. The expected fair value of $54 per share in Year 3 represents our existing fair value per share of $38 increased at an annual rate of the firm's cost of equity less its dividend yield. The upside and downside ranges are derived in the same way, but from the upper and lower bounds of our fair value estimate range.
Pro Forma Financial Statements