With industrial production, capacity utilization, real disposable income, real personal consumption, real sales retail and food service sales, and real manufacturing and trade sales uniformly declining in their latest reports, coincident economic indicators – having generally peaked in July – are now following through on the weakness that we’ve persistently observed in leading economic measures. We continue to believe that the U.S. economy joined a global economic downturn during the third quarter of this year.
....
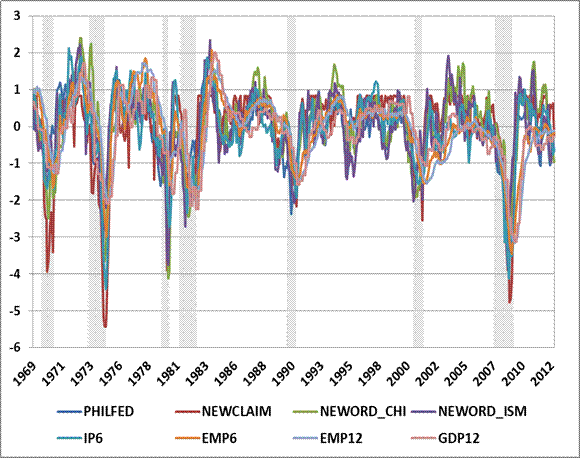
The chart below plots the standardized values (mean zero, unit variance) of these economic indicators since the 1960’s. Notice that 6-month and 12-month employment growth, as well as year-over-year GDP growth, clearly lag the somewhat more volatile but also more timely signals from production, new orders, and new employment claims.

...
How to Build a Time Machine
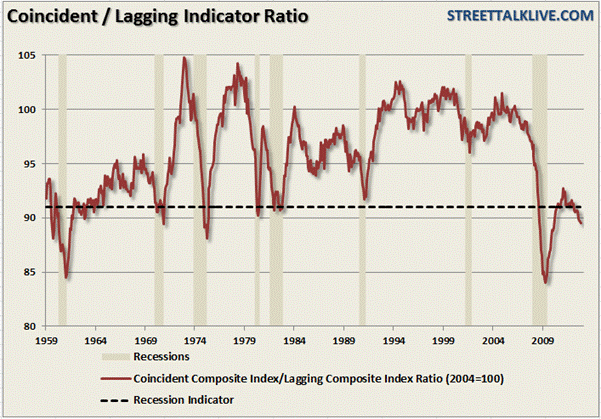
A couple of weeks ago, Lance Roberts of StreetTalkLive presented a nice chart of the ratio of coincident to lagging indicators from the Conference Board, noting that each time the ratio has fallen to current levels, the economy has either been in or close to a recession.

Read the complete commentary
....
The chart below plots the standardized values (mean zero, unit variance) of these economic indicators since the 1960’s. Notice that 6-month and 12-month employment growth, as well as year-over-year GDP growth, clearly lag the somewhat more volatile but also more timely signals from production, new orders, and new employment claims.

...
How to Build a Time Machine
A couple of weeks ago, Lance Roberts of StreetTalkLive presented a nice chart of the ratio of coincident to lagging indicators from the Conference Board, noting that each time the ratio has fallen to current levels, the economy has either been in or close to a recession.

Read the complete commentary