
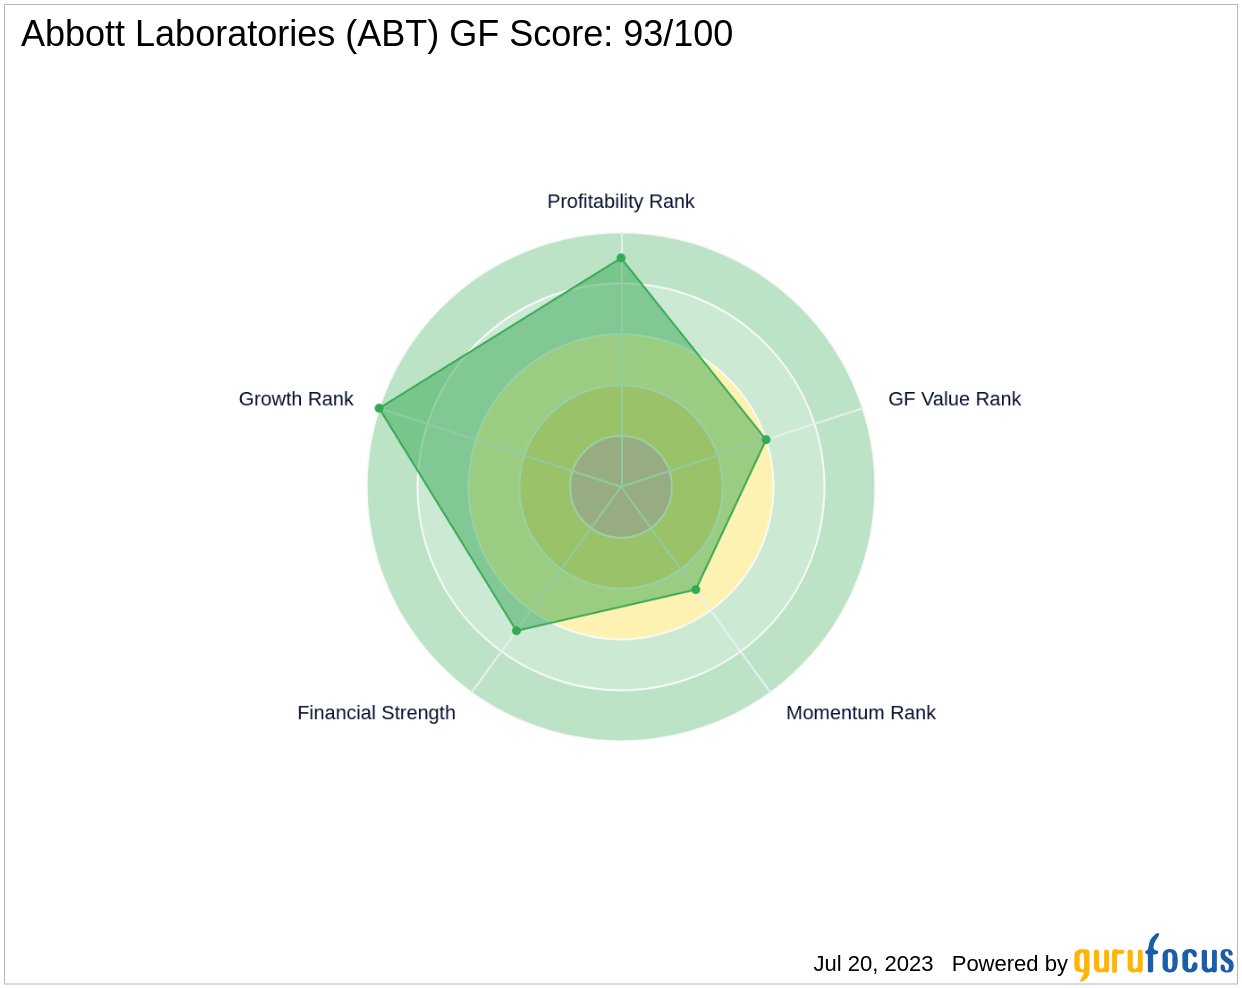
Abbott Laboratories (ABT, Financial), a leading player in the Medical Devices & Instruments industry, is currently trading at $111.28 with a market capitalization of $193.51 billion. The stock has seen a gain of 3.73% today and a 4.01% increase over the past four weeks. In this article, we will analyze Abbott Laboratories' performance using the GF Score, a comprehensive stock performance ranking system developed by GuruFocus. The GF Score, which ranges from 0 to 100, is closely correlated with the long-term performance of stocks. Abbott Laboratories has a GF Score of 93, indicating the highest outperformance potential.

Financial Strength Analysis
The Financial Strength Rank measures a company's financial situation based on its debt burden, debt to revenue ratio, and Altman Z-Score. Abbott Laboratories has a Financial Strength Rank of 7/10. Its interest coverage is 12.00, indicating a low debt burden. The company's debt to revenue ratio is 0.41, which is relatively low, and its Altman Z score is 4.80, suggesting a low bankruptcy risk.
Profitability Rank Analysis
The Profitability Rank assesses a company's profitability and its likelihood to remain profitable. Abbott Laboratories has a Profitability Rank of 9/10. Its Operating Margin is 16.77%, and its Piotroski F-Score is 5, indicating a healthy financial situation. The company has shown consistent profitability over the past 10 years and has a Predictability Rank of 4.
Growth Rank Analysis
The Growth Rank measures a company's revenue and profitability growth. Abbott Laboratories has a Growth Rank of 10/10, indicating strong growth. Its 5-year revenue growth rate is 10.10%, and its 3-year revenue growth rate is 11.40%. The company's 5-year EBITDA growth rate is 15.80%, suggesting a robust growth in its business operations.
GF Value Rank Analysis
The GF Value Rank is determined by the price-to-GF-Value ratio, a proprietary metric calculated based on historical multiples and an adjustment factor based on a company's past returns and growth. Abbott Laboratories has a GF Value Rank of 6/10, indicating a fair valuation.
Momentum Rank Analysis
The Momentum Rank is determined using the standardized momentum ratio and other momentum indicators. Abbott Laboratories has a Momentum Rank of 5/10, suggesting a moderate momentum in its stock price.
Competitor Analysis
Abbott Laboratories' main competitors in the industry are Medtronic PLC (MDT, Financial) with a GF Score of 79, Stryker Corp (SYK, Financial) with a GF Score of 91, and Boston Scientific Corp (BSX, Financial) with a GF Score of 75. Compared to its competitors, Abbott Laboratories has a higher GF Score, indicating a stronger performance potential.
Conclusion
In conclusion, Abbott Laboratories' overall GF Score of 93 suggests a high outperformance potential. The company's strong financial strength, high profitability, robust growth, fair valuation, and moderate momentum make it an attractive investment option. However, investors should also consider other factors such as market conditions and company-specific risks before making an investment decision.