

Despite a daily loss of 3.38% and a 3-month loss of 44.21%, SolarEdge Technologies Inc (SEDG, Financial) boasts an Earnings Per Share (EPS) of 5.17. This analysis aims to determine whether the stock is significantly undervalued. Read on for a comprehensive valuation analysis of SolarEdge Technologies.
Company Overview
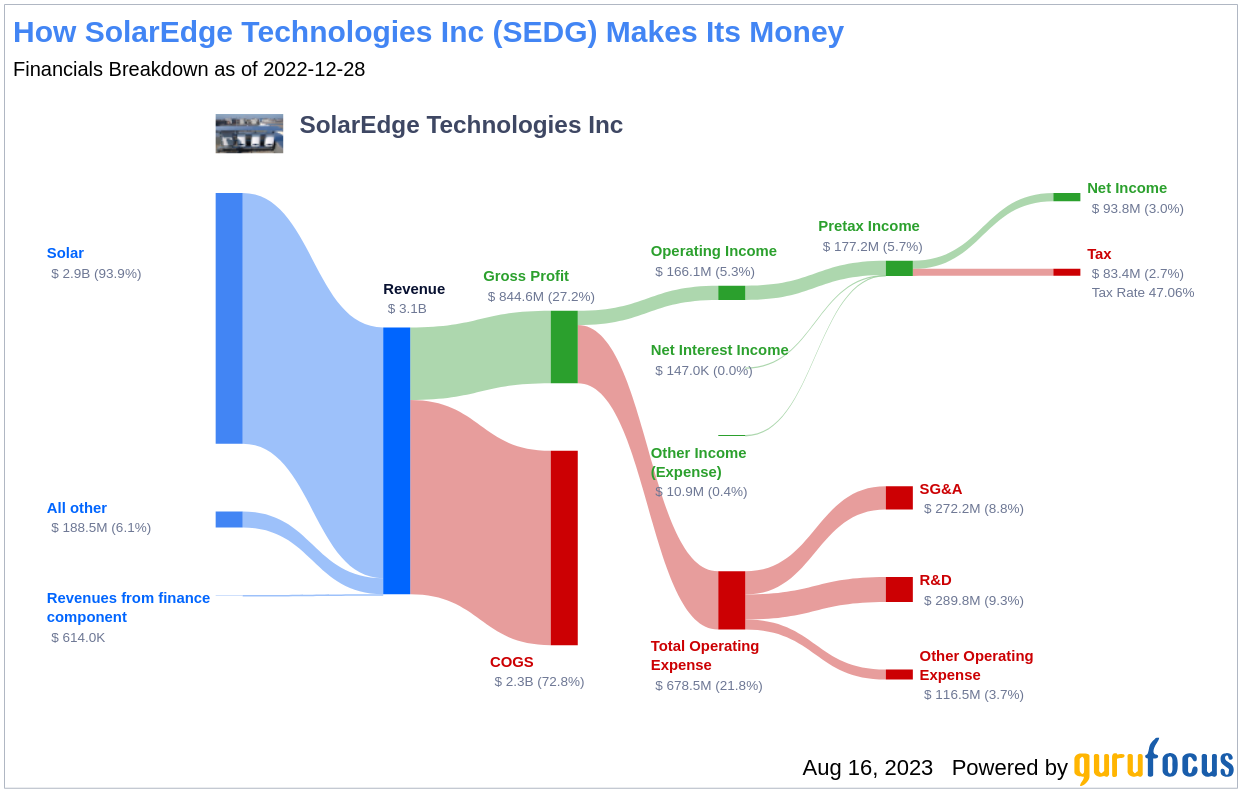
SolarEdge Technologies designs, develops, and sells direct current optimized inverter systems for solar photovoltaic installations. The company's system includes power optimizers, inverters, and a cloud-based monitoring platform. It caters to a broad range of solar market segments, from residential to commercial and small utility-scale solar installations. Its products are sold directly to solar installers, engineering, procurement, and construction firms and indirectly through distributors and electrical equipment wholesalers. The company also offers non-solar products targeting energy storage and e-mobility.
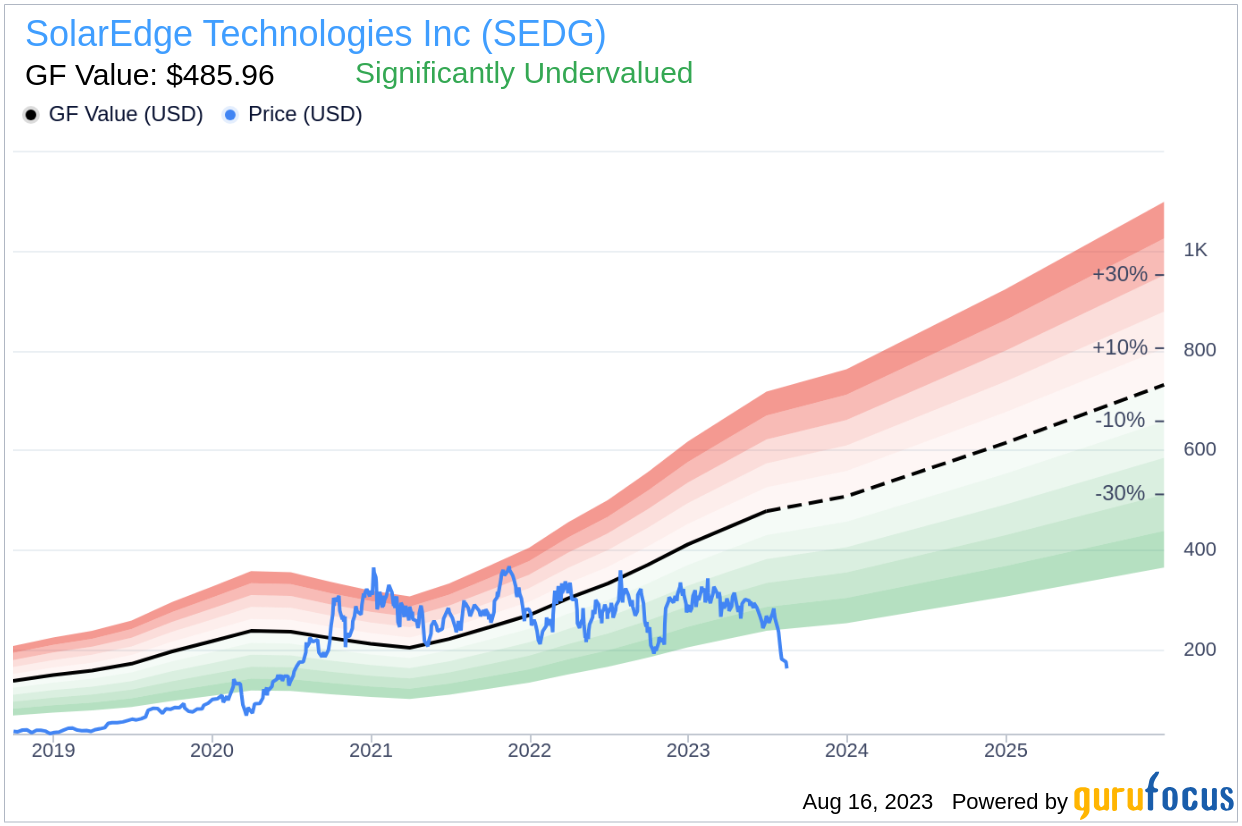
Despite its current share price of $164.26, SolarEdge Technologies has a GF Value, our estimate of fair value, of $485.96. This discrepancy suggests that the stock may be significantly undervalued.
Understanding the GF Value
The GF Value is a proprietary measure of a stock's intrinsic value, based on historical trading multiples, a GuruFocus adjustment factor, and future business performance estimates. If the stock price is significantly above the GF Value Line, it is overvalued and future returns are likely to be poor. Conversely, if it is significantly below the GF Value Line, its future return will likely be higher.
With a current share price of $164.26 and a market cap of $9.30 billion, SolarEdge Technologies (SEDG, Financial) appears to be significantly undervalued. As such, the long-term return of its stock is likely to be much higher than its business growth.
Link: These companies may deliver higher future returns at reduced risk.
Financial Strength
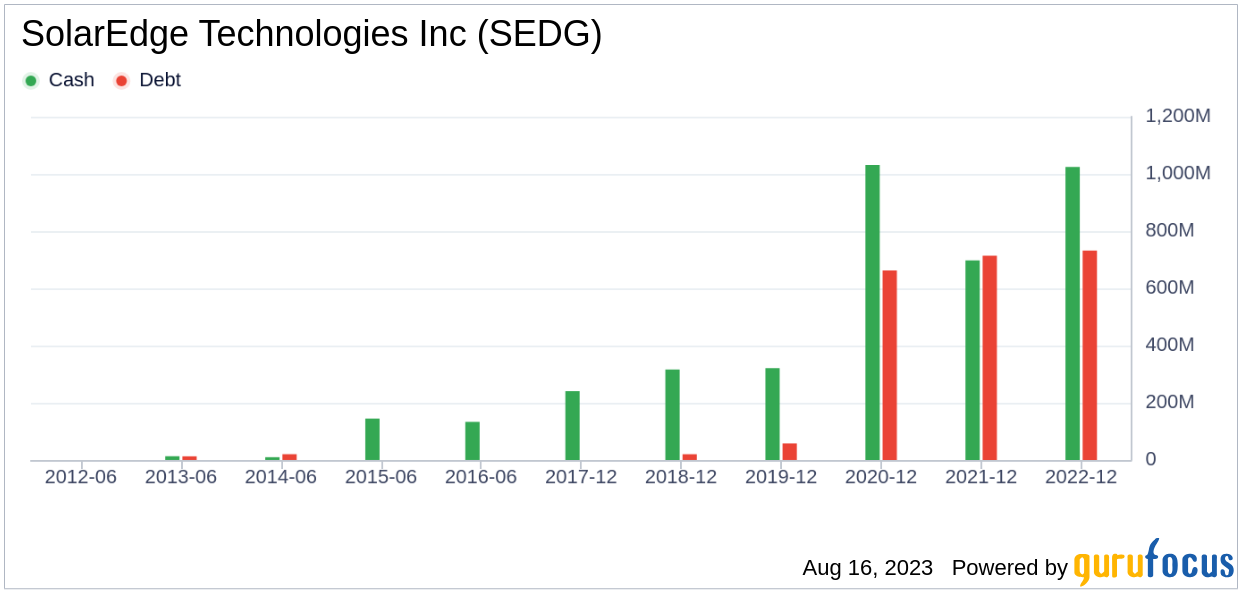
Companies with poor financial strength pose a high risk of permanent capital loss. To avoid this, investors must review a company's financial strength before purchasing shares. SolarEdge Technologies has a cash-to-debt ratio of 1.43, which ranks worse than 55.57% of companies in the Semiconductors industry. However, its overall financial strength is 8 out of 10, indicating strong financial health.
Profitability and Growth
Consistently profitable companies offer less risk for investors. SolarEdge Technologies has been profitable 8 out of the past 10 years. Over the past twelve months, the company had a revenue of $3.70 billion and an Earnings Per Share (EPS) of $5.17. Its operating margin is 10.04%, ranking better than 57.49% of companies in the Semiconductors industry. Overall, SolarEdge Technologies' profitability is strong, with a rank of 8 out of 10.
Growth is a crucial factor in a company's valuation. The faster a company is growing, the more likely it is to be creating value for shareholders. SolarEdge Technologies' growth rate over the past 3 years is 23.5%, ranking better than 74.74% of companies in the Semiconductors industry. However, its 3-year average EBITDA growth rate is -0.9%, ranking worse than 78.31% of companies in the industry.
ROIC vs WACC
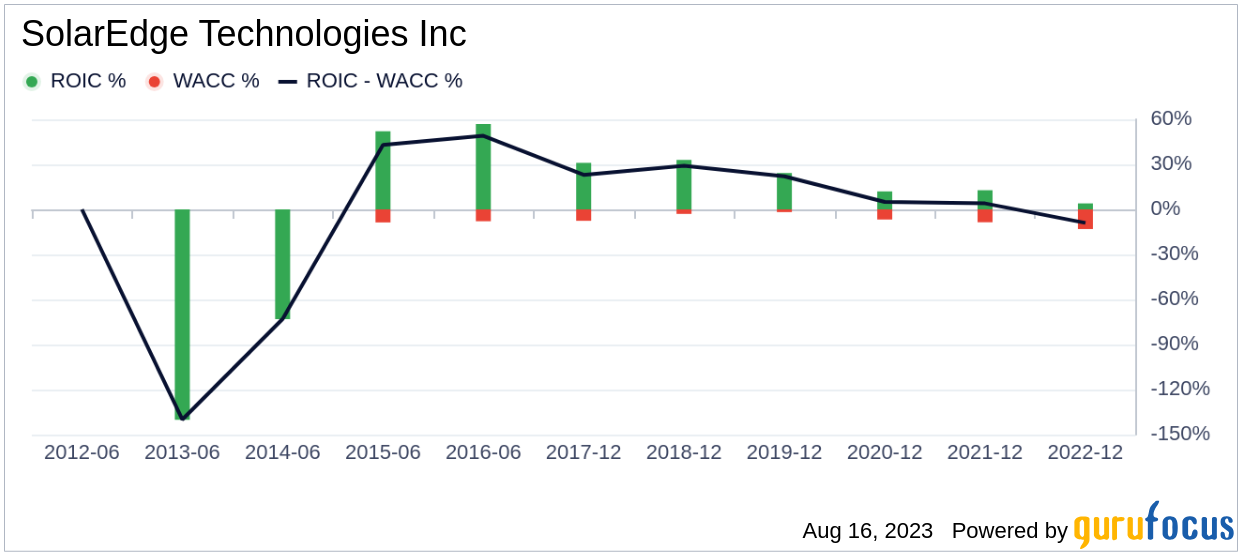
Comparing a company's return on invested capital (ROIC) to the weighted average cost of capital (WACC) is another method of determining its profitability. When the ROIC is higher than the WACC, the company is creating value for shareholders. For the past 12 months, SolarEdge Technologies's ROIC is 9.74, and its WACC is 11.19.
Conclusion
In conclusion, SolarEdge Technologies (SEDG, Financial) appears to be significantly undervalued. The company's financial condition is strong and its profitability is robust, although its growth ranks worse than 78.31% of companies in the Semiconductors industry. To learn more about SolarEdge Technologies stock, you can check out its 30-Year Financials here.
To find out the high-quality companies that may deliver above-average returns, please check out GuruFocus High Quality Low Capex Screener.