

As of August 17, 2023, Cisco Systems Inc (CSCO, Financial), a leading player in the hardware industry, is trading at $54.99 with a market cap of $224.07 billion. The company's stock price has seen a gain of 3.82% today and an impressive 8.32% over the past four weeks. In this article, we will delve into the company's GF Score and its significance in stock performance analysis.
GF Score Analysis of Cisco Systems Inc
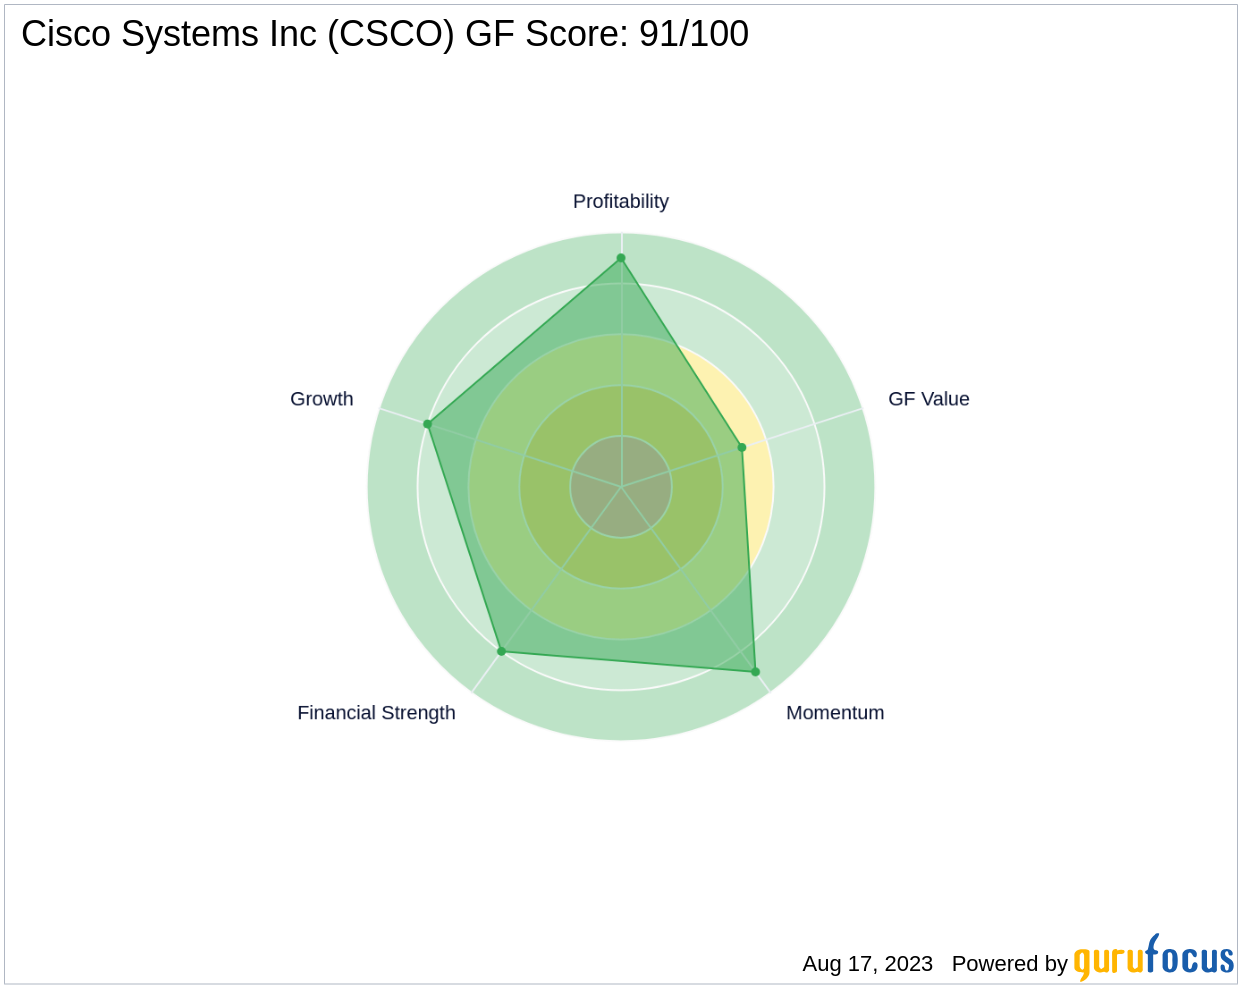
Cisco Systems Inc boasts a high GF Score of 91 out of 100, indicating the highest outperformance potential. The GF Score is a stock performance ranking system developed by GuruFocus, which is closely correlated to the long-term performances of stocks. It takes into account five key aspects: Financial Strength, Profitability Rank, Growth Rank, GF Value Rank, and Momentum Rank. A higher GF Score generally translates to higher returns, making Cisco Systems Inc an attractive investment option.
Financial Strength Analysis
The Financial Strength of Cisco Systems Inc is ranked 8 out of 10, indicating a robust financial situation. This rank is based on factors such as interest coverage (35.55), debt to revenue ratio (0.15), and Altman Z score (3.55). These figures suggest that the company is well-positioned to manage its debt obligations and maintain financial stability.
Profitability Rank Analysis
Cisco Systems Inc's Profitability Rank stands at 9 out of 10, reflecting high profitability. This rank is determined by factors such as Operating Margin (26.48%), Piotroski F-Score (6), and a consistent profitability trend over the past 10 years. This high rank indicates that the company's business is likely to remain profitable.
Growth Rank Analysis
The company's Growth Rank is 8 out of 10, indicating strong growth potential. This rank is based on the 5-year revenue growth rate (5.10), 3-year revenue growth rate (1.80), and 5-year EBITDA growth rate (4.80). These figures suggest that Cisco Systems Inc has consistently expanded its business operations over the years.
GF Value Rank Analysis
The GF Value Rank of Cisco Systems Inc is 5 out of 10. This rank is determined by the price-to-GF-Value ratio, a proprietary metric calculated based on historical multiples and an adjustment factor based on a company's past returns and growth. This moderate rank suggests that the company's stock is fairly valued.
Momentum Rank Analysis
Cisco Systems Inc's Momentum Rank is 9 out of 10, indicating strong momentum. This rank is determined using the standardized momentum ratio and other momentum indicators, suggesting that the company's stock price is likely to continue its upward trend.
Competitive Analysis
When compared to its main competitors in the hardware industry, Cisco Systems Inc holds a strong position. Motorola Solutions Inc (MSI, Financial) has a GF Score of 81, Hewlett Packard Enterprise Co (HPE, Financial) has a GF Score of 74, and Zebra Technologies Corp (ZBRA, Financial) matches Cisco Systems Inc with a GF Score of 91. This comparison indicates that Cisco Systems Inc is a competitive player in its industry.
Conclusion
In conclusion, Cisco Systems Inc's high GF Score, robust financial strength, high profitability, strong growth potential, fair valuation, and strong momentum make it a compelling investment option. The company's strong performance relative to its competitors further underscores its attractiveness. However, as with any investment, potential investors should conduct their own due diligence before making a decision.