

With a daily loss of 2.6%, a three-month gain of 7.51%, and an Earnings Per Share (EPS) (EPS) of 4.72, Alphabet Inc (GOOGL, Financial) presents an intriguing case for value investors. The primary question at hand is, is Alphabet (GOOGL) modestly undervalued? This article delves into the valuation analysis of Alphabet, providing an in-depth examination of its financial performance and future prospects. We encourage you to read on for valuable insights.
Company Introduction
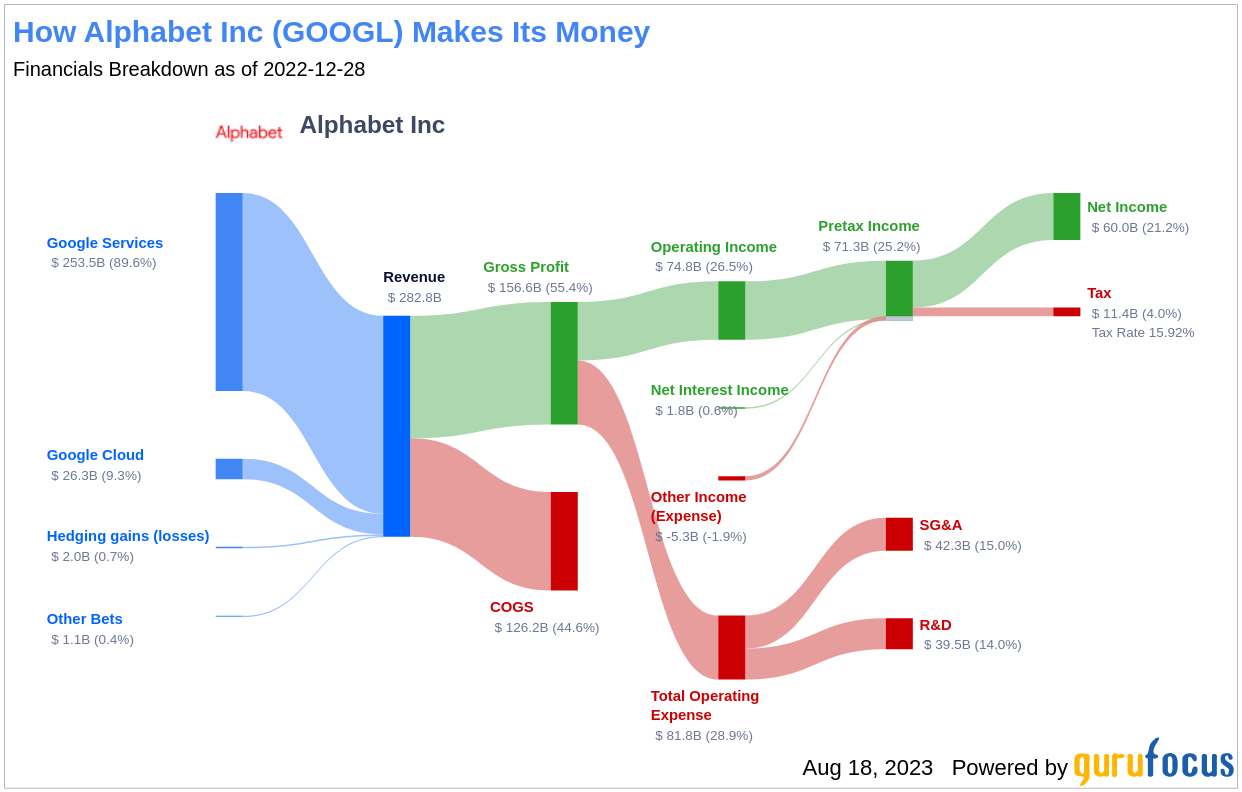
Alphabet Inc (GOOGL, Financial) is a holding company, with internet media giant Google as a wholly-owned subsidiary. Google generates 99% of Alphabet's revenue, the majority of which comes from online ads. The company also earns from sales of apps, content on Google Play and YouTube, cloud service fees, and other licensing revenue. Additionally, sales from hardware such as Chromebooks, the Pixel smartphone, and smart home products contribute to Alphabet's revenue. The company also invests in moonshot projects that aim to enhance health, provide faster internet access, and enable self-driving cars, among others.
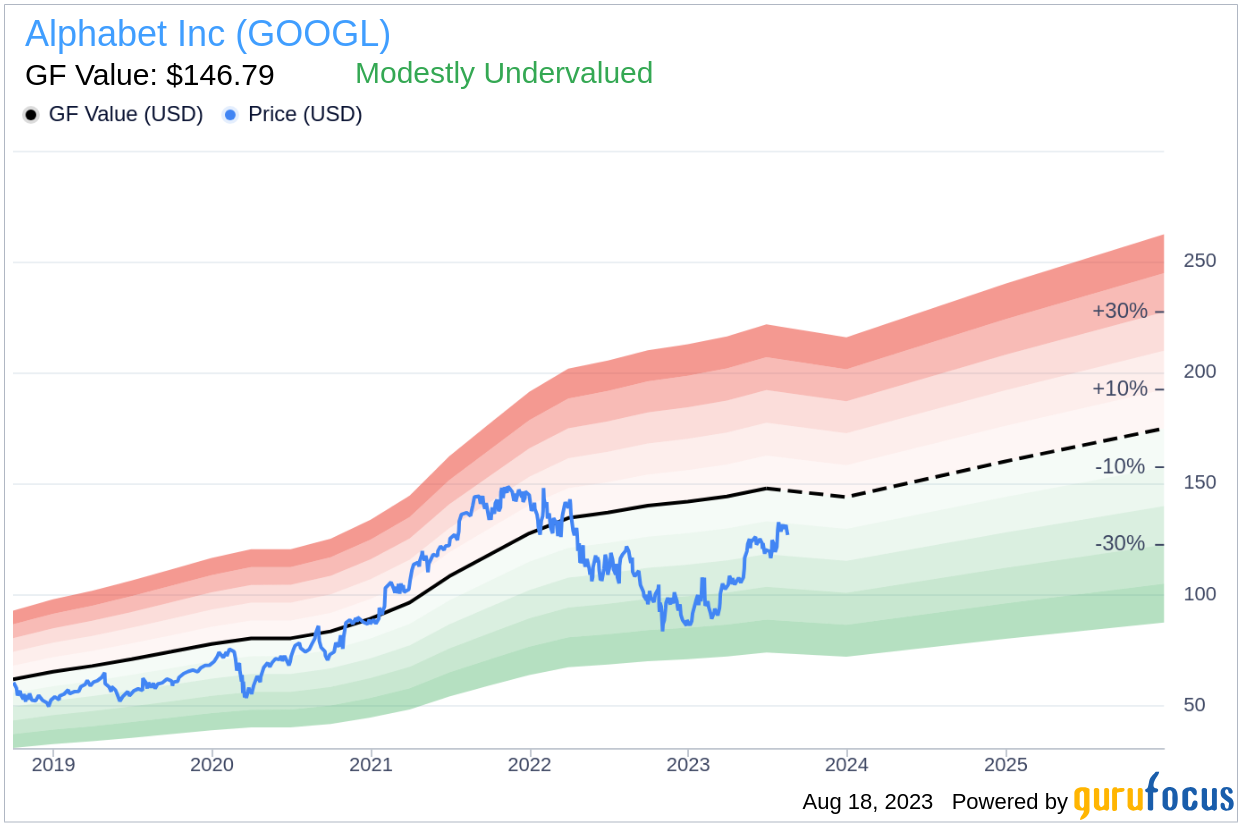
Comparing the stock price of Alphabet (GOOGL, Financial) with its GF Value, an estimation of fair value, gives an insight into the company's value. At its current price of $126.54 per share and a market cap of $1.60 trillion, Alphabet stock appears to be modestly undervalued.
Understanding the GF Value
The GF Value is a proprietary measure reflecting the current intrinsic value of a stock. It is calculated based on historical multiples, a GuruFocus adjustment factor based on past performance and growth, and future business performance estimates. If the stock price is significantly above the GF Value Line, it is overvalued, and its future return is likely to be poor. Conversely, if it is significantly below the GF Value Line, its future return will likely be higher.
Given Alphabet's current price per share and market cap, the stock appears to be modestly undervalued. This implies that the long-term return of its stock is likely to be higher than its business growth.
Link: These companies may deliver higher future returns at reduced risk.
Financial Strength of Alphabet
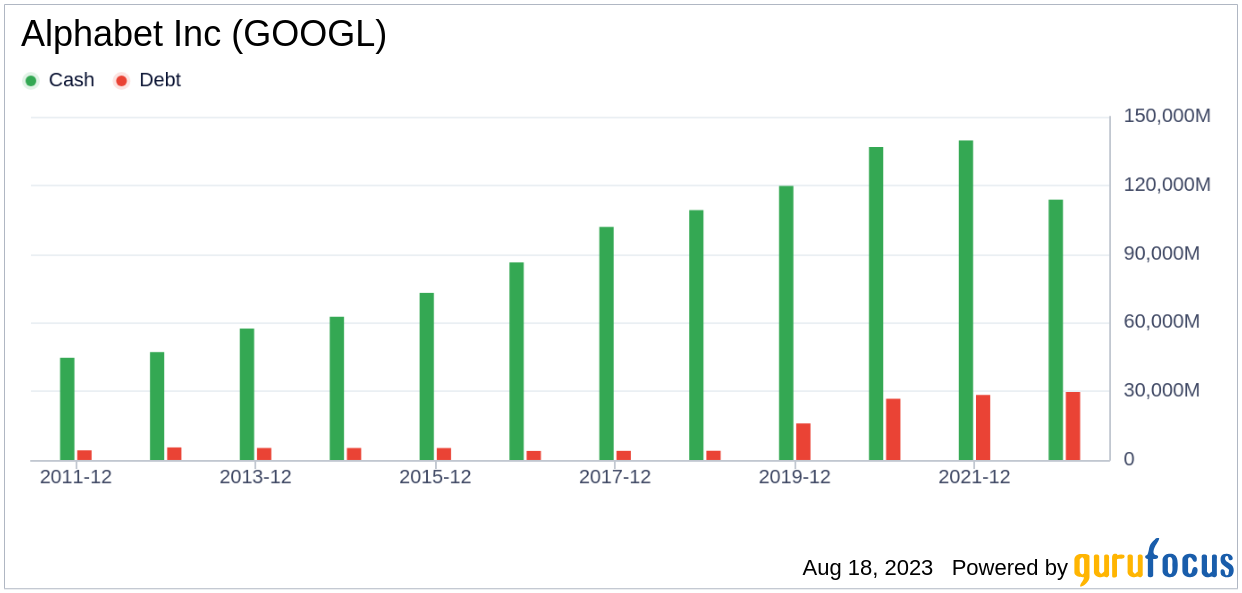
Before investing in a company, it's crucial to assess its financial strength. Companies with poor financial strength pose a higher risk of permanent loss. The cash-to-debt ratio and interest coverage provide a good understanding of a company's financial strength. Alphabet's cash-to-debt ratio stands at 4.06, ranking lower than 55.57% of companies in the Interactive Media industry. However, the overall financial strength of Alphabet is 9 out of 10, indicating strong financial health.
Profitability and Growth of Alphabet
Companies that have consistently shown profitability over the long term offer less risk for investors. Higher profit margins usually dictate a better investment compared to a company with lower profit margins. Alphabet has been profitable for 10 out of the past 10 years. Over the past twelve months, the company had a revenue of $289.50 billion and an EPS of $4.72. Its operating margin is 25.75%, which ranks better than 87.69% of companies in the Interactive Media industry. Overall, Alphabet's profitability is ranked 10 out of 10, indicating strong profitability.
Growth is one of the most important factors in the valuation of a company. Companies that grow faster create more value for shareholders, especially if that growth is profitable. Alphabet's average annual revenue growth is 22.9%, ranking better than 73.68% of companies in the Interactive Media industry. The 3-year average EBITDA growth is 21.8%, ranking better than 63.4% of companies in the Interactive Media industry.
ROIC vs WACC
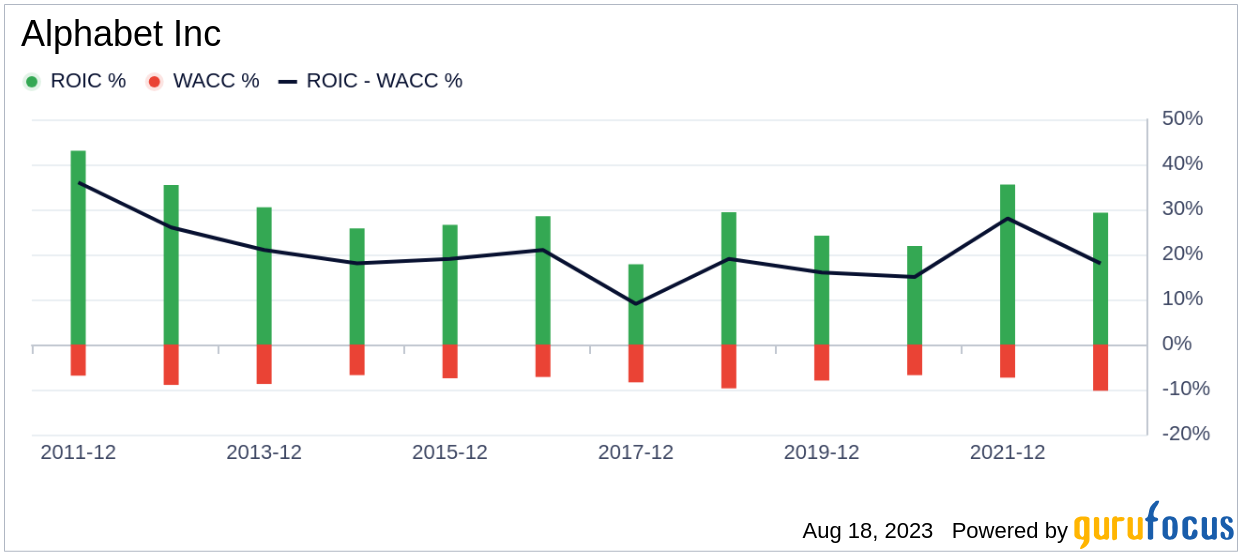
Comparing a company's return on invested capital (ROIC) to its weighted average cost of capital (WACC) can also evaluate a company's profitability. ROIC measures how well a company generates cash flow relative to the capital it has invested in its business. The WACC is the rate that a company is expected to pay on average to all its security holders to finance its assets. If the ROIC exceeds the WACC, the company is likely creating value for its shareholders. Over the past 12 months, Alphabet's ROIC was 27.32 while its WACC came in at 10.96.
Conclusion
In conclusion, Alphabet (GOOGL, Financial) appears to be modestly undervalued. The company's financial condition is strong, and its profitability is robust. Its growth ranks better than 63.4% of companies in the Interactive Media industry. To learn more about Alphabet stock, check out its 30-Year Financials here.
For high-quality companies that may deliver above-average returns, check out the GuruFocus High Quality Low Capex Screener.