

The stock of Texas Instruments Inc (TXN, Financial), a leading semiconductor manufacturer, has been experiencing some fluctuations recently. With a daily loss of -0.99%, and a 3-month loss of -3.77%, the stock's Earnings Per Share (EPS) (EPS) stands at 8.32. Despite these figures, the question arises: is the stock modestly undervalued? This article aims to provide a comprehensive analysis of Texas Instruments' valuation, encouraging readers to delve into the financial intricacies of the company.
Company Overview
Texas Instruments Inc (TXN, Financial), based in Dallas, is a prominent player in the semiconductor industry, generating over 95% of its revenue from semiconductors. The remainder comes from its well-known calculators. It holds the distinction of being the world's largest maker of analog chips, used to process real-world signals such as sound and power. Additionally, Texas Instruments maintains a leading market share position in processors and microcontrollers used in a wide array of electronics applications.
Currently, the stock price of Texas Instruments stands at $169, while its GF Value, an estimation of the fair value, is $186.88. This comparison suggests that the stock might be modestly undervalued. The following analysis will delve deeper into the company's value, merging financial assessment with key company details.

Understanding the GF Value
The GF Value represents the intrinsic value of a stock, computed using a proprietary method. This method takes into consideration historical trading multiples, a GuruFocus adjustment factor based on past performance and growth, and future business performance estimates. The GF Value Line provides an overview of the fair value at which the stock should ideally be traded.
According to this calculation, the stock of Texas Instruments (TXN, Financial) is believed to be modestly undervalued. This suggests that the long-term return of its stock is likely to be higher than its business growth. The GF Value chart of Texas Instruments provides a visual representation of this analysis.

Link: These companies may deliver higher future returns at reduced risk.
Financial Strength
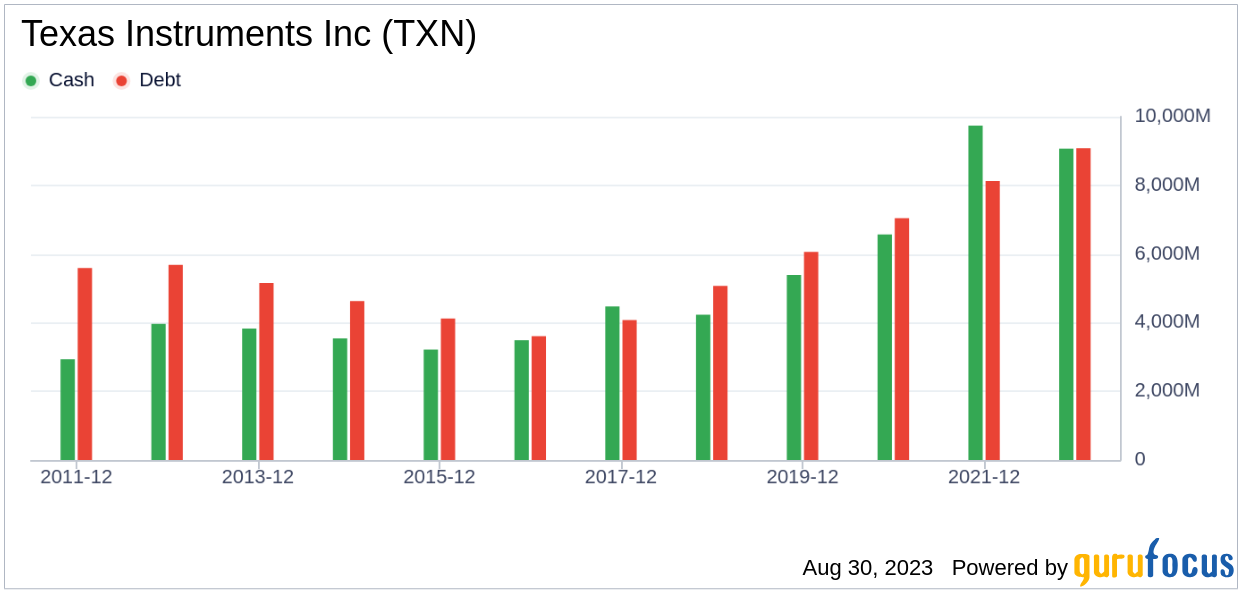
Investing in companies with poor financial strength carries a higher risk of permanent loss of capital. Therefore, it is crucial to review the financial strength of a company before deciding to buy its stock. Texas Instruments has a cash-to-debt ratio of 0.85, which is worse than 68.67% of 897 companies in the Semiconductors industry. The overall financial strength of Texas Instruments is ranked at 7 out of 10 by GuruFocus, indicating that it is fair.
Profitability and Growth
Investing in profitable companies carries less risk, especially in companies that have demonstrated consistent profitability over the long term. Texas Instruments has been profitable 10 years over the past 10 years. During the past 12 months, the company had revenues of $18.80 billion and Earnings Per Share (EPS) of $8.32. Its operating margin of 47.21% is better than 98.4% of 937 companies in the Semiconductors industry. Overall, GuruFocus ranks Texas Instruments's profitability as strong.
One of the most important factors in the valuation of a company is its growth. Companies that grow faster create more value for shareholders, especially if that growth is profitable. The average annual revenue growth of Texas Instruments is12.7%, which ranks better than 51.5% of 866 companies in the Semiconductors industry. The 3-year average EBITDA growth is 18.4%, which ranks worse than 54.75% of 769 companies in the Semiconductors industry.
ROIC vs WACC
A company's profitability can also be evaluated by comparing its return on invested capital (ROIC) to its weighted average cost of capital (WACC). ROIC measures how well a company generates cash flow relative to the capital it has invested in its business. WACC is the rate that a company is expected to pay on average to all its security holders to finance its assets. If the ROIC exceeds the WACC, the company is likely creating value for its shareholders. During the past 12 months, Texas Instruments's ROIC was 46.19, while its WACC came in at 9.43.

Conclusion
In summary, the stock of Texas Instruments (TXN, Financial) is believed to be modestly undervalued. The company's financial condition is fair, and its profitability is strong. However, its growth ranks worse than 54.75% of 769 companies in the Semiconductors industry. To learn more about Texas Instruments stock, you can check out its 30-Year Financials here.
To find out the high-quality companies that may deliver above-average returns, please check out GuruFocus High Quality Low Capex Screener.