
PR Newswire
HALIFAX, NS, Sept. 12, 2023
Shares Outstanding: 326,382,261
Trading Symbols: TSX: GGD
OTCQX: GLGDF
Increase of 55% in Measured & Indicated AgEq Ounces and Increase of 55% in NPV from previous January 2021 MRE and PEA
HALIFAX, NS, Sept. 12, 2023 /PRNewswire/ - GoGold Resources Inc. (TSX: GGD) (OTCQX: GLGDF) ("GoGold", "the Company") is pleased to release the results of its updated Preliminary Economic Assessment ("PEA") and Mineral Resource Estimate ("MRE") at its Los Ricos South ("LRS") Project located in Jalisco State, Mexico. The updated PEA and MRE include the addition of the Eagle concession to the Project, acquired in October 2022, as well as additional drilling completed in the Main Zone of the Project since the release of the initial PEA in January 2021.
Highlights of the PEA, with a base case silver price of US$23.75/oz and gold price of US$1,850/oz are as follows (all figures in US dollars unless otherwise stated):
- After-Tax net present value ("NPV") (using a discount rate of 5%) of US$458 Million with an After-Tax IRR of 37% (Base Case);
- 11-year mine life producing a total of 88 Million payable silver equivalent ounces ("AgEq"), consisting of 47 Million silver ounces, 493 Thousand gold ounces, and 14 Million pounds of copper;
- Initial capital costs of $148 Million, including $19 Million in contingency costs, over an expected 18 month build, additional expansion capital of $69 Million, and sustaining capital costs of $72 Million over the life of mine ("LOM");
- Average LOM operating cash costs of $8.15/oz AgEq, and all in sustaining costs ("AISC") of $9.02/oz AgEq
- Average annual production of 8 Million AgEq oz;
- Approximately half of LOM metal production is long hole underground ("UG"), and approximately half is open pit ("OP") mining;
"We are very pleased with the work completed by our consultants and our technical team on the Mineral Resource and PEA for Los Ricos South. The projected cash flows are very substantial, especially when combined with our Los Ricos North PEA that was completed in March of this year. With an NPV of US$458M at LRS and US$413M at LRN, we now have a total NPV of US$871M in our Los Ricos district. We continue to advance the studies and we will complete a Pre-Feasibility Study ("PFS") for LRS this fall," said Brad Langille, President and CEO. "The PFS is ongoing and we are currently completing the advanced geotechnical work with our consultants. We will also continue to focus our efforts on the mine plan as we believe further optimization opportunities can be made. With our strong balance sheet we will continue to advance the project rapidly."
Highlights of the updated Mineral Resource:
- Increase of 55% in Measured & Indicated Silver Equivalent ("AgEq") Ounces from initial January 2021 MRE, with 39% increase in Measured & Indicated AgEq grade;
- Inclusion of 1.9 Million tonnes Measured & Indicated at excellent grade of 516 g/t AgEq in underground Eagle Deposit;
- Measured & Indicated Mineral Resource at LRS of 98.6 Million ounces AgEq grading 276 g/t AgEq contained in 11.1 Million tonnes ("Mt");
- Increased confidence in MRE, with conversion of approximately 9 Million ounces AgEq from initial January 2021 Inferred Mineral Resources to Measured & Indicated, resulting in 11 Million ounces AgEq in Inferred Mineral Resources at LRS grading 248 g/t AgEq contained in 1.4 Mt;
- Total Los Ricos Measured & Indicated Mineral Resources of 186 Million ounces AgEq, including Los Ricos North
- Total Los Ricos Inferred Mineral Resources of 84 Million ounces AgEq, including Los Ricos North
The updated PEA was prepared by independent consultants P&E Mining Consultants Inc ("P&E"), with metallurgical test work completed by SGS Canada Inc.'s Lakefield office ("SGS"), geotechnical study by Golder & Associates of Tucson, process plant design and costing by D.E.N.M. Engineering Ltd., and environmental and permitting led by CIMA Mexico.
Following are tables and figures showing key assumptions, results, and sensitivities.
Assumption / Result | Unit | Value | Assumption / Result | Unit | Value | |
Total OP Plant Feed Mined | kt | 9,367 | Net Revenue | US$M | 2,049 | |
Total UG Plant Feed Mined | kt | 4,325 | Initial Capital Costs | US$M | 148 | |
Total Plant Feed Mined | kt | 13,692 | Expansion Capital Costs | US$M | 69 | |
Operating Strip Ratio | Ratio | 7.4 | Sustaining Capital Costs | US$M | 72 | |
Silver Grade1 | g/t | 125 | OP Mining Costs | $/t Plant Feed | 12.13 | |
Gold Grade1 | g/t | 1.18 | UG Mining Costs | $/t Plant Feed | 43.85 | |
AgEq Grade1 | g/t | 217 | LOM Mining Costs | $/t Plant Feed | 22.15 | |
Silver Recovery | % | 86 | Operating Cash Cost | US$/oz AgEq | 8.15 | |
Gold Recovery | % | 95 | All in Sustaining Cost | US$/oz AgEq | 9.02 | |
Silver Price | US$/oz | 23.75 | Mine Life | Yrs | 11 | |
Gold Price | US$/oz | 1,850 | Average process rate | t/day | 3,349 | |
Copper Price | US$/lb | 4.00 | After-Tax NPV (5% discount) | US$M | 458 | |
Payable Silver Metal | Moz | 46.8 | Pre-Tax NPV (5% discount) | US$M | 708 | |
Payable Gold Metal | koz | 493 | After-Tax IRR | % | 36.6 | |
Payable Copper | Mlb | 13.5 | Pre-Tax IRR | % | 49.1 | |
Payable AgEq | Moz | 88.2 | After-Tax Payback Period | Yrs | 2.3 |
1. | Grades shown are LOM average process plant feed grades including both OP and UG sources. External dilution of approximately |
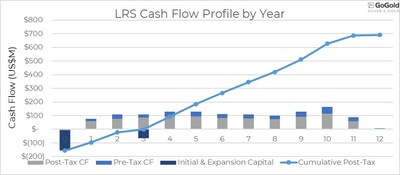
Figure 1 above highlights the excellent post-tax cash flows associated with the LRS project. The economics of the project have been evaluated based on the base case scenario US$23.75/oz silver price and gold price of US$1,850/oz. As illustrated in the following sensitivity tables, the project remains robust even at lower commodity prices or with higher costs.
Sensitivity | Base | ||||||
Silver Price (US$/oz) | 17 | 19 | 21 | 23.75 | 26 | 30 | 33 |
Gold Price (US$/oz) | 1,324 | 1,480 | 1,636 | 1,850 | 2,025 | 2,337 | 2,571 |
After-Tax NPV (5%) (US$M) | 185 | 266 | 346 | 458 | 548 | 710 | 831 |
After-Tax IRR (%) | 19.7 | 25.1 | 30.2 | 36.6 | 41.6 | 49.9 | 55.7 |
After-Tax Payback (years) | 3.6 | 3.0 | 2.6 | 2.3 | 2.1 | 1.7 | 1.6 |
Sensitivity | -20 % | -10 % | Base | 10 % | 20 % |
Operating Costs – NPV (US$M) | 526 | 492 | 458 | 423 | 389 |
Operating Costs – IRR (%) | 40.6 | 38.6 | 36.6 | 34.6 | 32.5 |
Capital Costs – NPV (US$M) | 495 | 476 | 458 | 439 | 420 |
Capital Costs – IRR (%) | 45.2 | 40.5 | 36.6 | 33.3 | 30.4 |
The LRS Project has been envisioned as a combined underground and open pit mining operation, with contract underground mining in years one to seven of the mine plan, supplemented by contract open pit mining in years three to eleven.
The process plant is comprised of conventional crushing and grinding followed by cyanide tank leaching. Back end filtration is required to maximize water recycling (dry stack tailings) as well as a SART (sulfidation, acidification re-neutralization and thickening) circuit to re-generate cyanide back to the process and to produce a saleable Cu2S copper sulfide product. Water supply to the process plant is provided by a nearby seasonally charged water dam and high voltage grid power is provided by the local utility. Expansion capital includes the cost to increase the process plant capacity from 1,750 tonnes per day to 4,000 tonnes per day in year three.
Type | Initial (US$k) | Expansion (US$k)1 | Sustaining (US$k) | Total (US$k) |
Process Plant direct costs | 54,475 | 42,700 | 12,125 | 109,300 |
Underground development | 60,706 | 48,473 | 109,179 | |
Pre-stripping | 19,074 | 500 | 19,574 | |
Infrastructure | 9,980 | 1,250 | 11,230 | |
Project indirect costs | 3,750 | 3,750 | ||
Total | 128,911 | 61,774 | 62,348 | 253,033 |
Contingency (15%) | 19,337 | 6,747 | 9,352 | 35,436 |
Total | 148,247 | 68,521 | 71,700 | 288,469 |
1. Expansion capital is not included in AISC calculation |
Operating Costs (Average LOM) | US$/tonne Plant Feed | US$/tonne |
Open Pit Mining1 | 12.13 | 1.65 |
Underground Mining2 | 43.85 | |
Total LOM Mining3 | 22.15 | |
Processing ($/t processed) | 27.10 | |
General and Admin ($/t processed) | 2.63 | |
Total ($/t processed) | 51.88 |
1. | Open pit mining costs include a double-benched waste rock and mineralized material |
2. | Bulk underground long hole mining. $43.85 is the cost of in-stope mining, additional |
3. | Average LOM mining cost of both open pit and underground. |
The contract underground mining will involve long hole stoping and cemented paste back filling of the mined-out stopes. Approximately 10% of the underground feed to the process plant will be sourced in close proximity to historical workings. The open pit mining will be contracted and carried out by drill and blast followed by conventional loading and truck haulage to the waste rock storage facilities and the process plant.
A metallurgical test program was carried out by SGS Lakefield of Ontario, Canada. The program included grinding and leaching as well as comminution testing. The leach samples comprised of drill core sampling rejects representing the various zones of the Mineral Resource and whole HQ drill core for the comminution work. This preliminary test program estimated average gold and silver respective metallurgical recoveries of 95% and 85%.
The Company has an agreement with the Ejido of Cinco Minas, which owns the surface rights over all of those concessions included in this PEA. The agreement allows GoGold to mine and explore the 1,280 hectares of land that is owned by the local Ejido for a period of twelve years with an option to renew for a further twelve years.
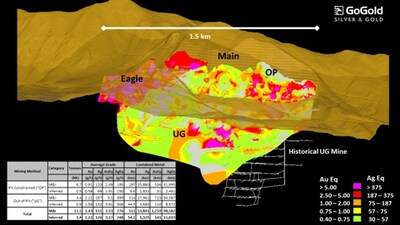
The basis for the PEA is the Mineral Resource Estimate completed by P&E for the Los Ricos South Project located in Jalisco State, Mexico, which has an effective date of September 8, 2023, with an NI 43-101 compliant Technical Report to be filed within 45 days of this news release. A summary of the Mineral Resource Estimate is provided in Table 6.
Mining Area | Category | Tonnes | Average Grade | Contained Metal | ||||||||
Au | Ag | Cu | AuEq | AgEq | Au | Ag | Cu | AuEq | AgEq | |||
(M) | (g/t) | (g/t) | ( %) | (g/t) | (g/t) | (koz) | (koz) | (Mlb) | (koz) | (koz) | ||
Pit | Measured | 3.9 | 1.08 | 142 | 0.03 | 2.94 | 231 | 135.9 | 17,858 | 2.3 | 369.1 | 28,898 |
Indicated | 2.8 | 0.68 | 89 | 0.03 | 1.87 | 146 | 60.7 | 8,022 | 1.9 | 167.3 | 13,097 | |
M&I | 6.7 | 0.91 | 120 | 0.03 | 2.49 | 195 | 196.6 | 25,880 | 4.2 | 536.4 | 41,995 | |
Inferred | 0.5 | 0.58 | 99 | 0.04 | 1.91 | 150 | 9.6 | 1,632 | 0.4 | 31.4 | 2,460 | |
Out-of-Pit6,7 | Measured | 0.7 | 3.60 | 298 | 0.35 | 7.94 | 621 | 80.7 | 6,679 | 5.4 | 178.1 | 13,940 |
Eagle | Indicated | 1.2 | 3.13 | 164 | 0.37 | 5.79 | 453 | 117.5 | 6,176 | 9.5 | 217.5 | 17,028 |
M&I | 1.9 | 3.30 | 214 | 0.36 | 6.59 | 516 | 198.2 | 12,855 | 15.0 | 395.6 | 30,969 | |
Inferred | 0.1 | 3.63 | 122 | 0.54 | 6.00 | 470 | 7.8 | 261 | 0.8 | 12.9 | 1,006 | |
Out-of-Pit6,7 | Measured | 1.1 | 1.22 | 194 | 0.06 | 3.79 | 297 | 44.7 | 7,093 | 1.6 | 138.8 | 10,865 |
Main | Indicated | 1.4 | 1.58 | 178 | 0.21 | 4.18 | 327 | 71.5 | 8,013 | 6.6 | 188.4 | 14,753 |
M&I | 2.5 | 1.42 | 185 | 0.15 | 4.00 | 313 | 116.2 | 15,106 | 8.1 | 327.2 | 25,618 | |
Inferred | 0.8 | 1.42 | 133 | 0.41 | 3.73 | 292 | 36.8 | 3,431 | 7.2 | 96.6 | 7,566 | |
Total | Measured | 5.7 | 1.42 | 172 | 0.07 | 3.72 | 291 | 261.4 | 31,631 | 9.3 | 686.0 | 53,703 |
Indicated | 5.4 | 1.45 | 129 | 0.15 | 3.33 | 260 | 249.7 | 22,210 | 18.0 | 573.2 | 44,878 | |
M&I | 11.1 | 1.43 | 151 | 0.11 | 3.53 | 276 | 511.0 | 53,841 | 27.3 | 1,259.2 | 98,582 | |
Inferred | 1.4 | 1.22 | 120 | 0.28 | 3.17 | 248 | 54.1 | 5,325 | 8.5 | 140.9 | 11,033 | |
1. | Mineral Resources which are not Mineral Reserves do not have demonstrated economic viability. The estimate of |
2. | The Inferred Mineral Resource in this estimate has a lower level of confidence than that applied to an Indicated Mineral |
3. | The Mineral Resources in this news release were estimated in accordance with the Canadian Institute of Mining, |
4. | Historically mined areas were depleted from the Mineral Resource model. |
5. | The pit constrained AgEq cut-off grade of 38 g/t Ag was derived from US$1,800/oz Au price, US$23.00/oz Ag price, 85% |
6. | The out-of-pit AgEq cut-off grade of 130 g/t Ag was derived from US$1,800/oz Au price, US$23.00/oz Ag price, 85% Ag |
7. | AgEq and AuEq were calculated at an Ag/Au ratio of 86.5:1 for pit constrained and 89.6:1 for out-of-pit. |
A total of 585 drill holes totalling 93,591 metres were used in the MRE.
P&E collaborated with GoGold personnel to develop the mineralization models, estimates, and reporting criteria for the Resources at Los Ricos. Mineralization models were initially developed by GoGold and were reviewed and modified by P&E. A total of eight individual mineralized domains have been identified through drilling, surface and historical underground sampling. The modeled mineralization domains are constrained by individual wireframes based on a 0.30 g/t AuEq cut-off for low-grade domains or 3.0 g/t AuEq for high-grade domains.
Mineralization wireframes were used as hard boundaries for the purposes of estimation.
A three-dimensional sub-blocked model, with 3m x