

Meta Platforms Inc (META, Financial) has seen a daily gain of 2.49% and a 3-month gain of 6.35%. With an Earnings Per Share (EPS) of 8.58, the question arises: is the stock modestly undervalued? This article delves into the comprehensive valuation analysis of Meta Platforms, providing insights into its financial strength, profitability, growth, and intrinsic value. Read on to find out whether it's the right time to invest in META.
Company Overview
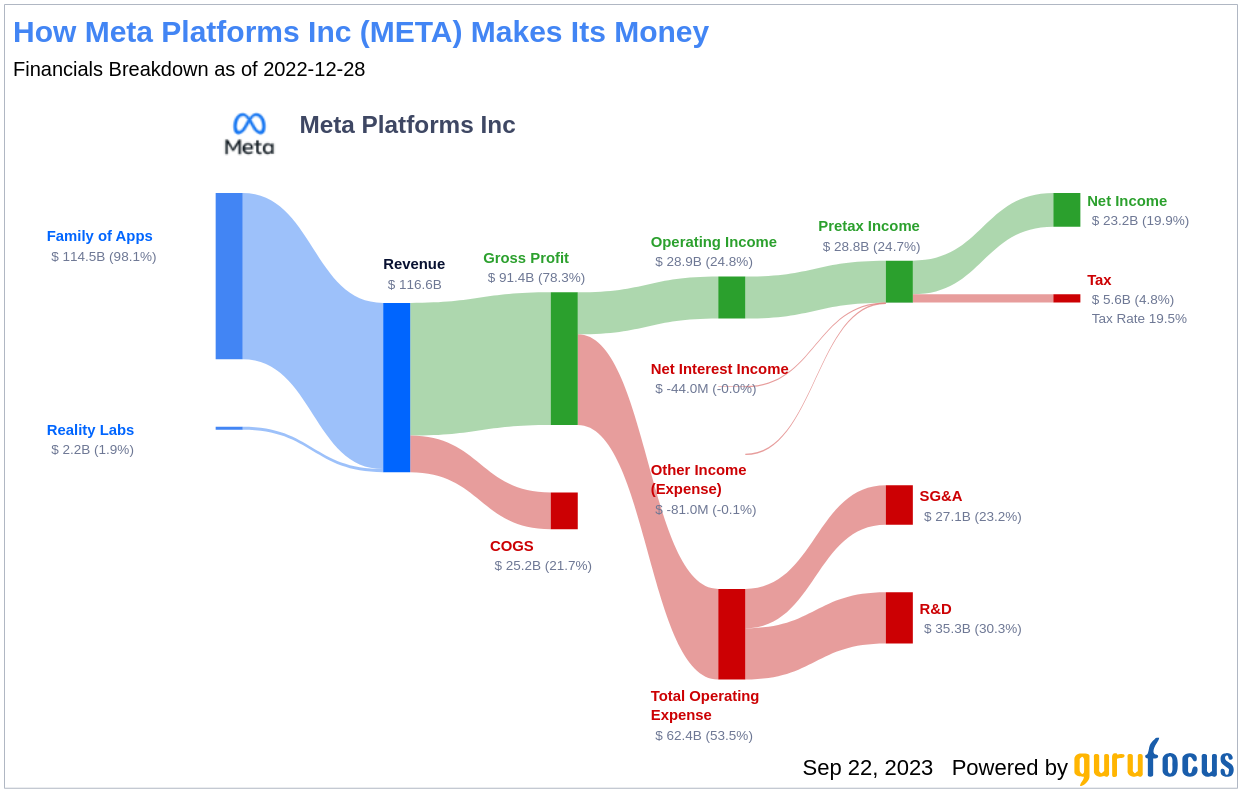
Meta Platforms Inc, the world's largest online social network, boasts 3.8 billion monthly active users across its family of apps. The firm's ecosystem primarily comprises the Facebook app, Instagram, Messenger, WhatsApp, and numerous features surrounding these products. With advertising revenue representing more than 90% of the firm's total revenue, Meta Platforms has a significant market presence. However, is this market presence reflected in its stock value? Let's find out.
Understanding GF Value
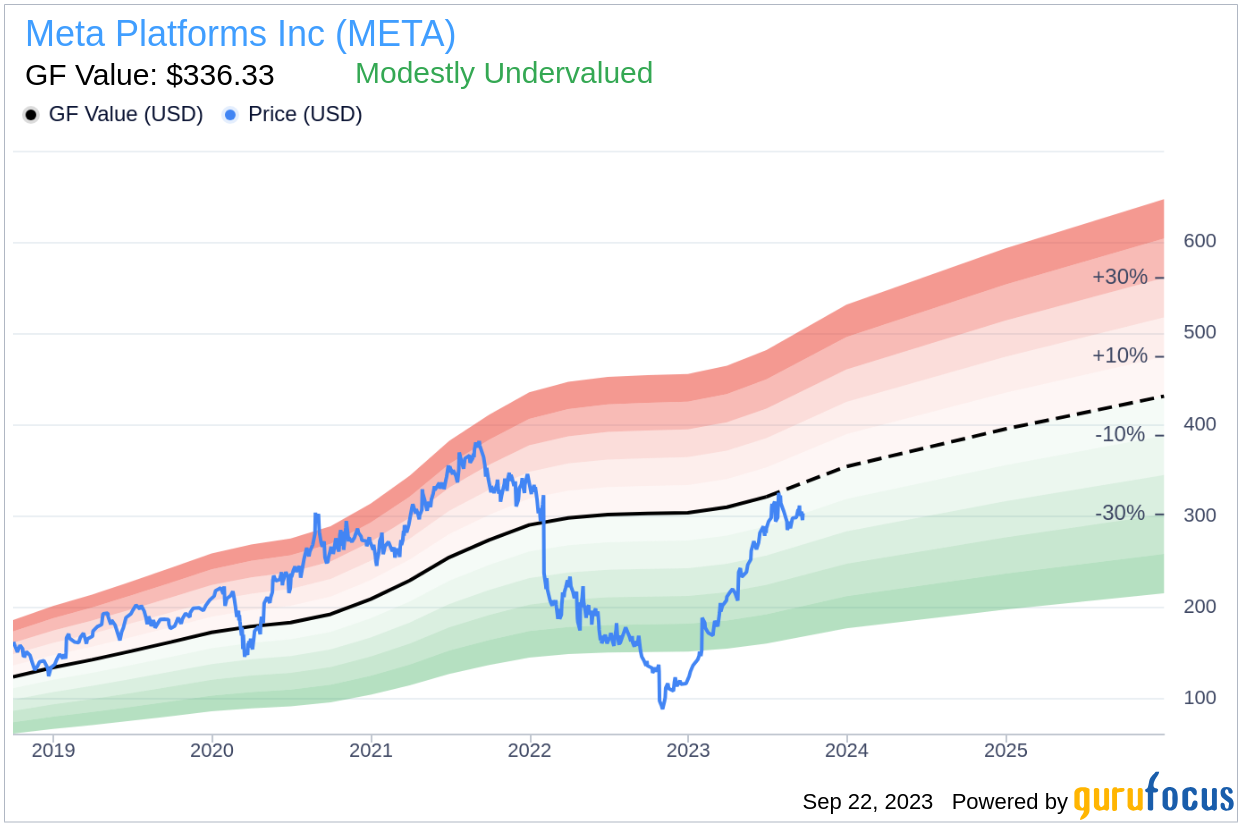
The GF Value represents the current intrinsic value of a stock derived from our unique method. The GF Value Line on our summary page provides an overview of the fair value at which the stock should be traded. It is calculated based on historical multiples that the stock has traded at, a GuruFocus adjustment factor based on the company's past returns and growth, and future estimates of business performance.
According to GuruFocus Value calculation, Meta Platforms stock appears to be modestly undervalued. With its current price of $303.1 per share and the market cap of $779.90 billion, Meta Platforms stock seems to offer a higher long-term return than its business growth.
Financial Strength
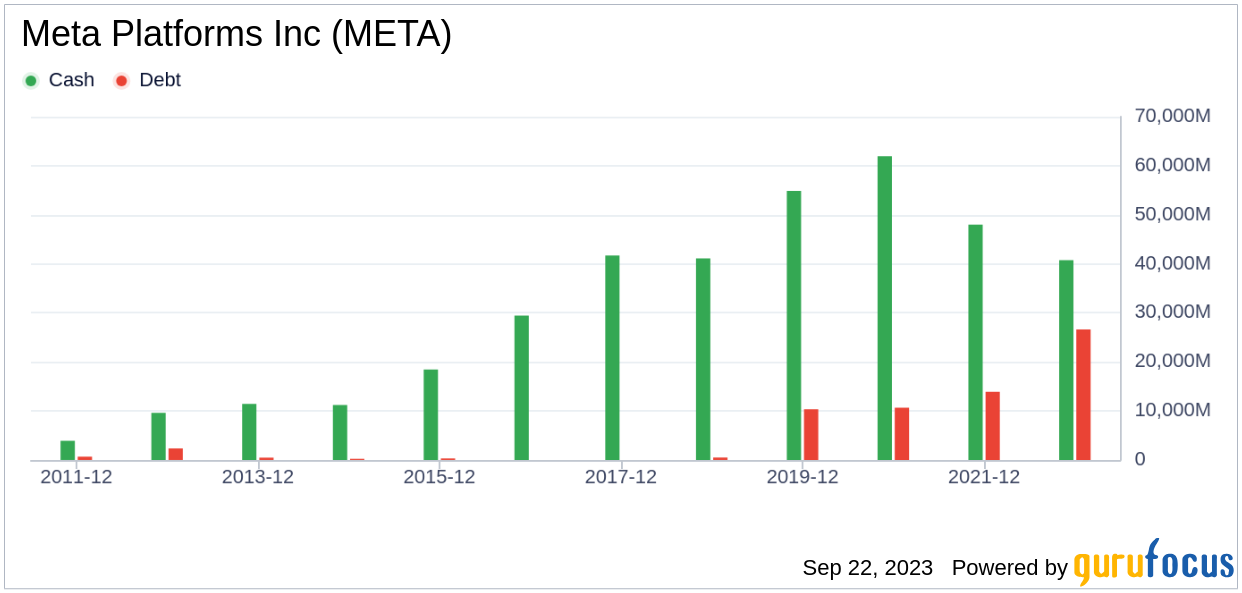
Investing in companies with poor financial strength can lead to a higher risk of permanent loss. Meta Platforms, with a cash-to-debt ratio of 1.48, falls below 71% of 569 companies in the Interactive Media industry. However, its overall financial strength is 8 out of 10, indicating a strong financial base.
Profitability and Growth
Investing in profitable companies, especially those with consistent profitability over the long term, is less risky. Meta Platforms has been profitable 10 years over the past decade. Its operating margin is 23.8%, which ranks better than 83.93% of 585 companies in the Interactive Media industry. The 3-year average annual revenue growth of Meta Platforms is 20.6%, which ranks better than 70.68% of 515 companies in the Interactive Media industry.
ROIC vs WACC
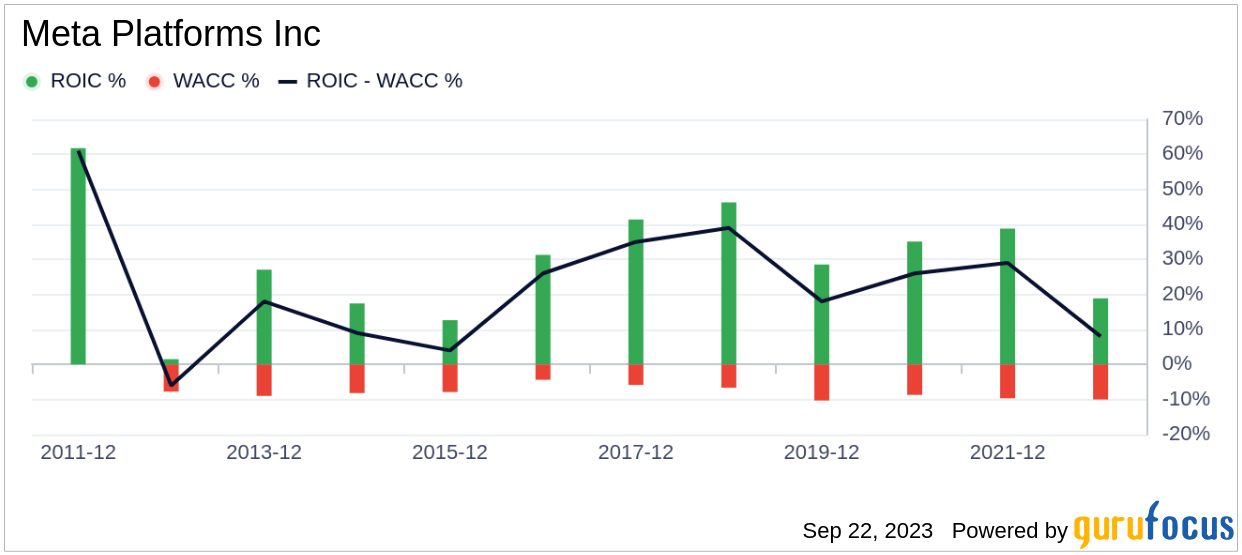
Comparing a company's return on invested capital (ROIC) to the weighted average cost of capital (WACC) is another method of determining profitability. ROIC measures how well a company generates cash flow relative to the capital it has invested in its business. When the ROIC is higher than the WACC, it implies the company is creating value for shareholders. For the past 12 months, Meta Platforms's ROIC is 17.19, and its WACC is 10.33.
Conclusion
In conclusion, the stock of Meta Platforms appears to be modestly undervalued. The company's financial condition is strong, and its profitability is robust. Its growth ranks better than 52.97% of 387 companies in the Interactive Media industry. To learn more about Meta Platforms stock, you can check out its 30-Year Financials here.
To find out high-quality companies that may deliver above-average returns, please check out GuruFocus High Quality Low Capex Screener.