
Long-established in the Asset Management industry, Blackstone Inc (BX, Financial) has enjoyed a stellar reputation. However, it has recently witnessed a daily loss of 2.23%, juxtaposed with a three-month change of 21.96%. Fresh insights from the GF Score hint at potential headwinds. Notably, its diminished rankings in financial strength, growth, and valuation suggest that the company might not live up to its historical performance. Join us as we dive deep into these pivotal metrics to unravel the evolving narrative of Blackstone Inc.
Understanding the GF Score
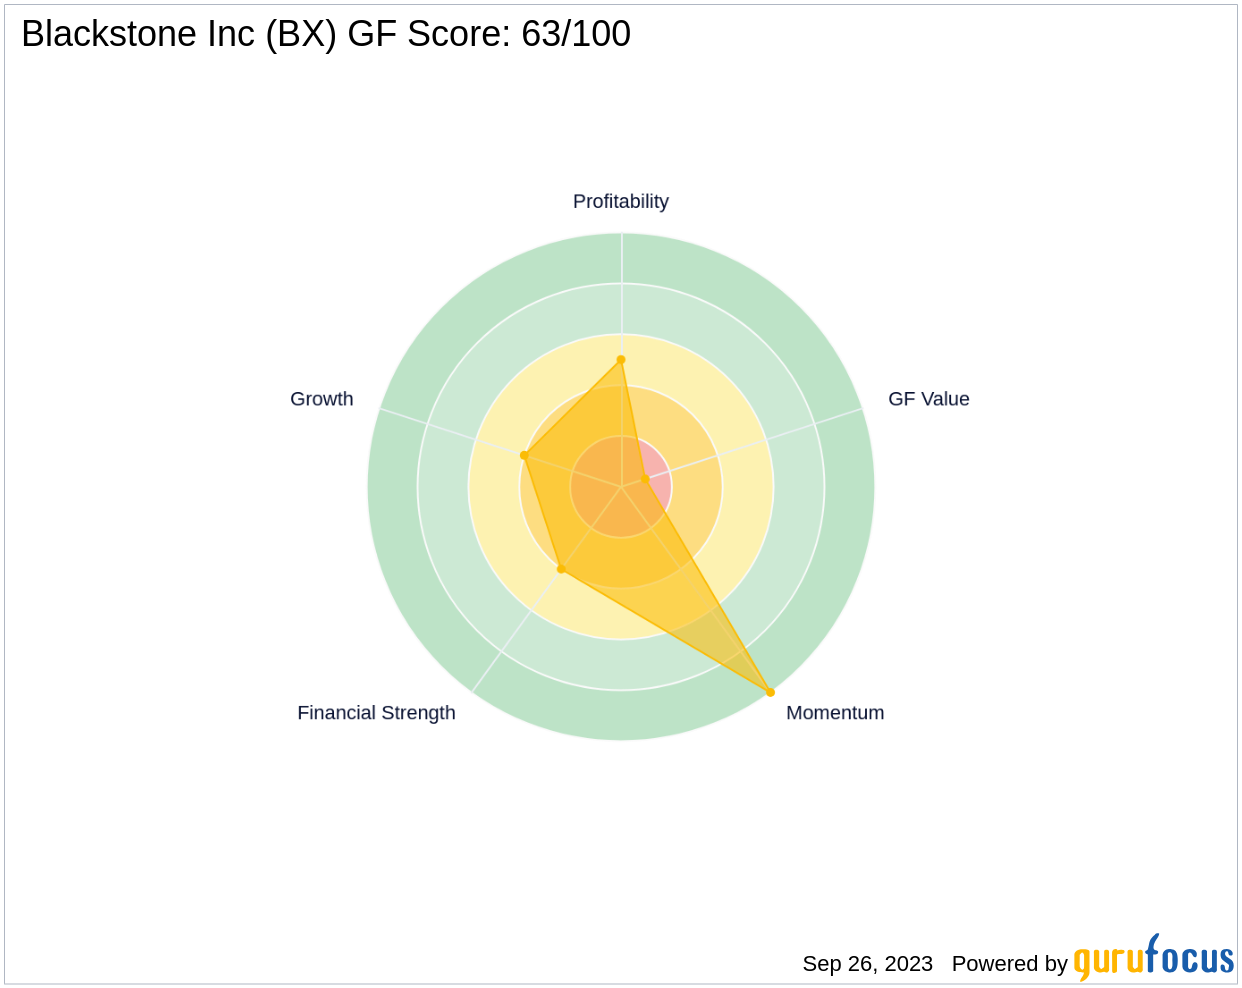
The GF Score is a stock performance ranking system developed by GuruFocus using five aspects of valuation, which has been found to be closely correlated to the long-term performances of stocks by backtesting from 2006 to 2021. The stocks with a higher GF Score generally generate higher returns than those with a lower GF Score. Therefore, when picking stocks, investors should invest in companies with high GF Scores. The GF Score ranges from 0 to 100, with 100 as the highest rank.
- Financial strength rank: 4/10
- Profitability rank: 5/10
- Growth rank: 4/10
- GF Value rank: 1/10
- Momentum rank: 10/10
Based on the above method, GuruFocus assigned Blackstone Inc the GF Score of 63 out of 100, which signals poor future outperformance potential.
Blackstone Inc: A Snapshot
Blackstone Inc, with a market cap of $81.35 billion and sales of $6.26 billion, is one of the world's largest alternative asset managers. As of March 2023, it had $991.3 billion in total assets under management, including $732.0 billion in fee-earning assets. The company operates through four core business segments: private equity, real estate, credit & insurance, and hedge fund solutions. While primarily serving institutional investors, it also caters to high-net-worth clients. Blackstone operates through 25 offices located in the Americas, Europe and the Middle East, and the Asia-Pacific region.

Financial Strength Analysis
Blackstone Inc's financial strength indicators present some concerning insights about the company's balance sheet health. The company's low cash-to-debt ratio at 0.25 indicates a struggle in handling existing debt levels. Additionally, the company's debt-to-Ebitda ratio is 9999, which is above Joel Tillinghast's warning level of 4 and is worse than 0% of 344 companies in the Asset Management industry. Tillinghast said in his book “Big Money Think's Small: Biases, Blind Spots, and Smarter Investing” that a high debt-to-Ebitda ratio can be a red flag unless tangible assets cover the debt.
Profitability Analysis
Blackstone Inc's low Profitability rank can also raise warning signals. The company's Net Margin has declined over the past five years (-7.89%), as shown by the following data: 2018: 26.60; 2019: 33.20; 2020: 19.98; 2021: 35.18; 2022: 24.50; .
Growth Prospects
A lack of significant growth is another area where Blackstone Inc seems to falter, as evidenced by the company's low Growth rank. Lastly, Blackstone Inc predictability rank is just one star out of five, adding to investor uncertainty regarding revenue and earnings consistency.

Conclusion
Given Blackstone Inc's financial strength, profitability, and growth metrics, the GF Score highlights the firm's unparalleled position for potential underperformance. While the company has a strong reputation in the Asset Management industry, its current financial indicators suggest that it may struggle to maintain its historical performance. Therefore, investors should exercise caution when considering this stock.
GuruFocus Premium members can find more companies with strong GF Scores using the following screener link: GF Score Screen