

Trimble Inc (TRMB, Financial) has seen a 2.6% increase in its stock price, closing at $50.49 per share on September 28, 2023. However, it has experienced a 3.47% loss over the past three months. With an Earnings Per Share (EPS) of 1.38, the question arises: Is the stock modestly undervalued? This article conducts an in-depth analysis of Trimble's valuation, providing a comprehensive insight into the company's financial status.
Introduction to Trimble Inc
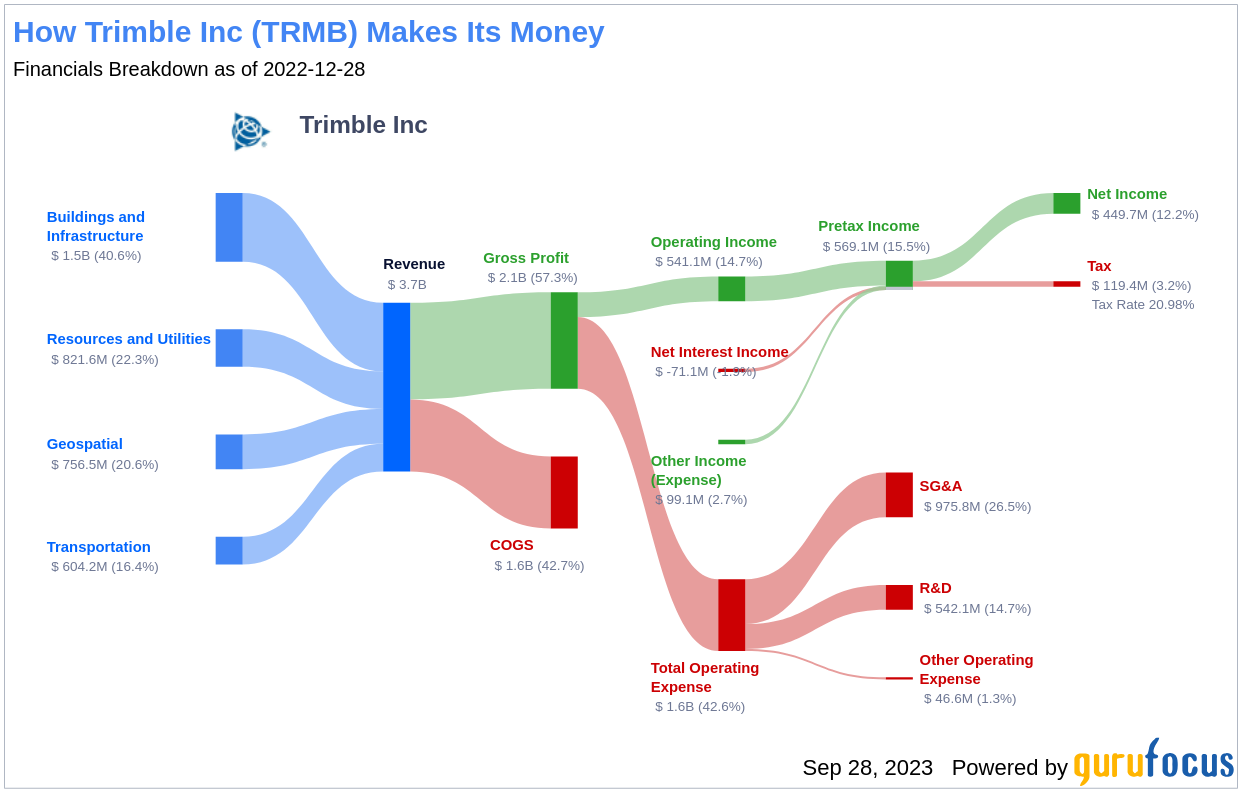
Trimble Inc is renowned for its location-based solutions that utilize global positioning system (GPS), laser, optical, and inertial technologies. Its product portfolio is diverse, encompassing 3D laser scanning, flow and application control systems, monitoring systems, water management, and navigation infrastructure. Trimble serves a broad range of industries, including agriculture, architecture, civil engineering, survey and land administration, construction, and geospatial. The company operates in four reportable segments: Buildings and Infrastructure, Geospatial, Resources and Utilities, and Transportation. Most of its revenues are generated from the US and Europe, with the rest coming from the Asia Pacific and other markets.
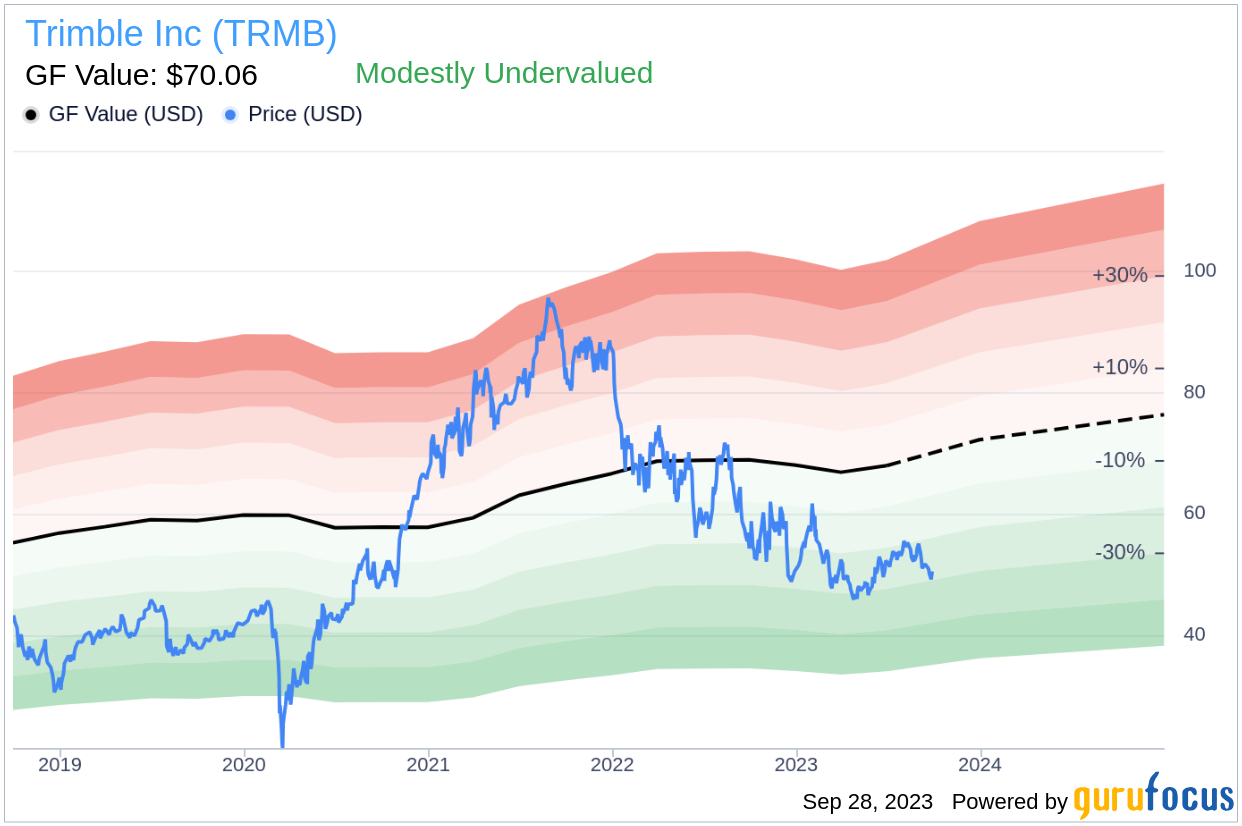
Understanding Trimble's GF Value
The GF Value is a proprietary measure that represents the intrinsic value of a stock. It is calculated based on historical trading multiples, a GuruFocus adjustment factor based on past performance and growth, and future business performance estimates. The GF Value Line provides an overview of the fair value at which the stock should ideally be traded. If the stock price is significantly above the GF Value Line, it is overvalued, and its future return is likely to be poor. Conversely, if it is significantly below the GF Value Line, its future return will likely be higher.
According to our calculation, Trimble (TRMB, Financial) appears to be modestly undervalued. Its current price of $50.49 per share and a market cap of $12.50 billion suggest a potential for higher long-term returns due to its relative undervaluation.
Assessing Trimble's Financial Strength
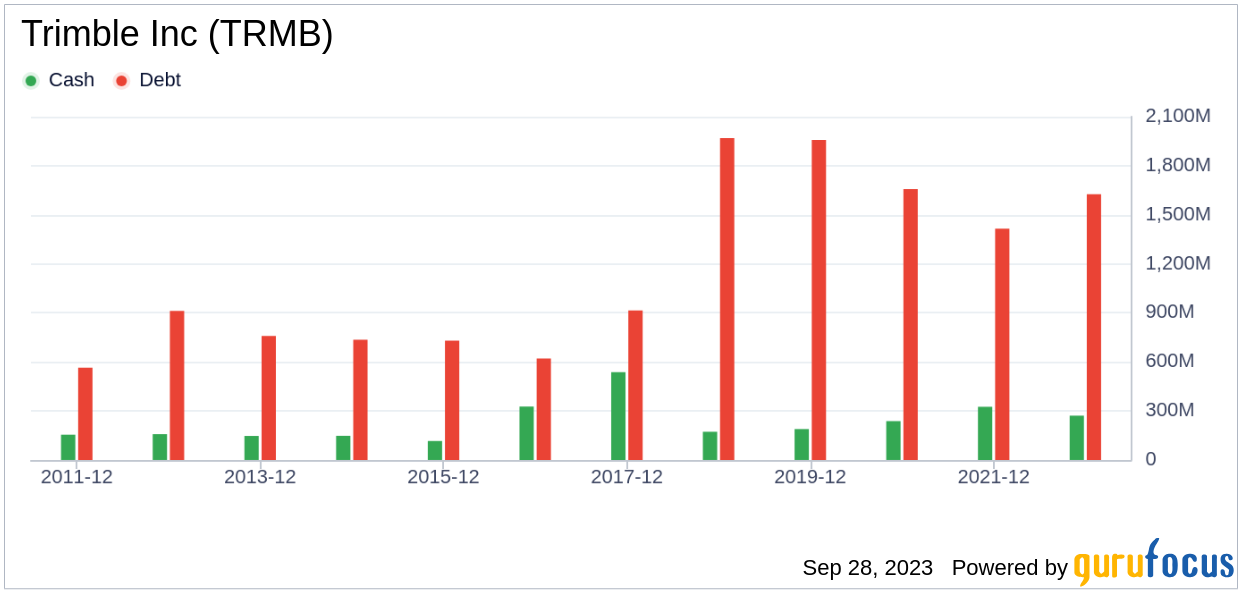
Investing in companies with poor financial strength poses a high risk of permanent capital loss. To avoid this, it is crucial to examine a company's financial strength before purchasing shares. The cash-to-debt ratio and interest coverage are great indicators of a company's financial strength. Trimble's cash-to-debt ratio of 0.07 ranks worse than 95.99% of 2372 companies in the Hardware industry, indicating fair financial strength.
Profitability and Growth of Trimble
Investing in profitable companies, especially those with consistent profitability over the long term, poses less risk. Trimble has been profitable for 10 out of the past 10 years. With an operating margin of 13.2%, it ranks better than 83.18% of 2456 companies in the Hardware industry. Trimble's average annual revenue growth is 4.4%, which ranks better than 50.64% of 2332 companies in the Hardware industry.
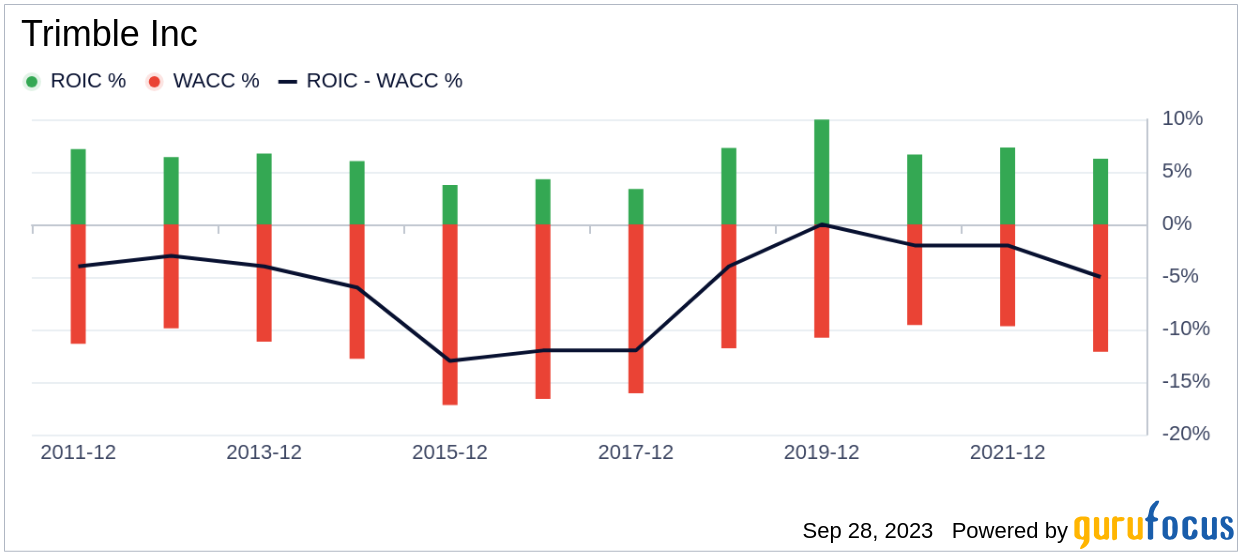
ROIC vs WACC
Comparing a company's return on invested capital (ROIC) to its weighted average cost of capital (WACC) can also evaluate its profitability. The ROIC measures how well a company generates cash flow relative to the capital it has invested in its business. The WACC is the rate that a company is expected to pay on average to all its security holders to finance its assets. If the ROIC exceeds the WACC, the company is likely creating value for its shareholders. Trimble's ROIC is 5.27 while its WACC came in at 13.62.
Conclusion
In conclusion, Trimble (TRMB, Financial) appears to be modestly undervalued. The company's financial condition is fair, and its profitability is strong. Its growth ranks worse than 53.54% of 1961 companies in the Hardware industry. For a more comprehensive understanding of Trimble's financials, you can check out its 30-Year Financials here.
For high-quality companies that may deliver above-average returns, check out GuruFocus High Quality Low Capex Screener.