

As of September 28, 2023, Hewlett Packard Enterprise Co (HPE, Financial) witnessed a daily gain of 3.1% and a 3-month gain of 7.32%. The company reported an Earnings Per Share (EPS) of 0.82. However, the question remains: is the stock modestly overvalued? This article aims to provide an in-depth analysis of HPE's valuation, guiding investors towards an informed decision.
Company Introduction
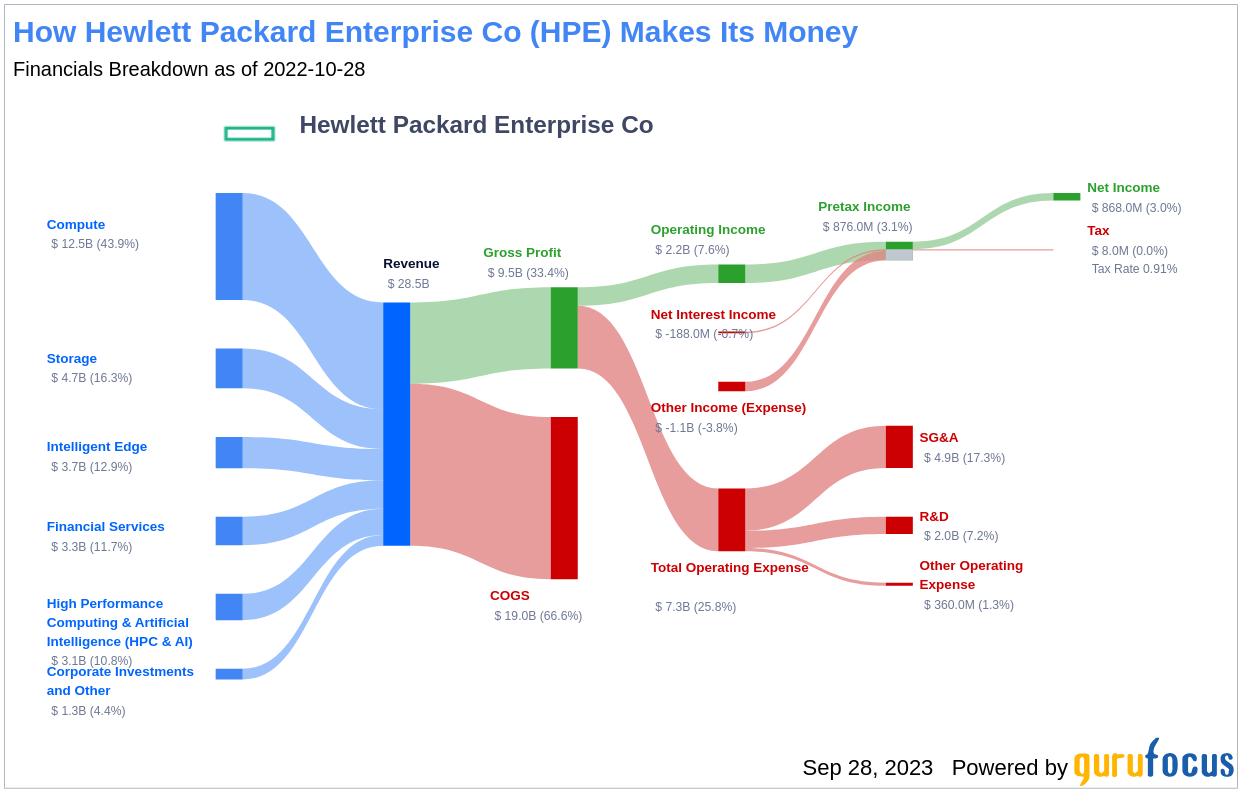
Hewlett Packard Enterprise Co (HPE, Financial) is a global technology vendor offering hardware and software solutions to enterprises. The company's primary product lines include compute servers, storage arrays, and networking equipment. With a mission to be a complete edge-to-cloud company, HPE enables hybrid clouds and hyperconverged infrastructure. The company employs an outsourced manufacturing model and has a workforce of 60,000 people worldwide.
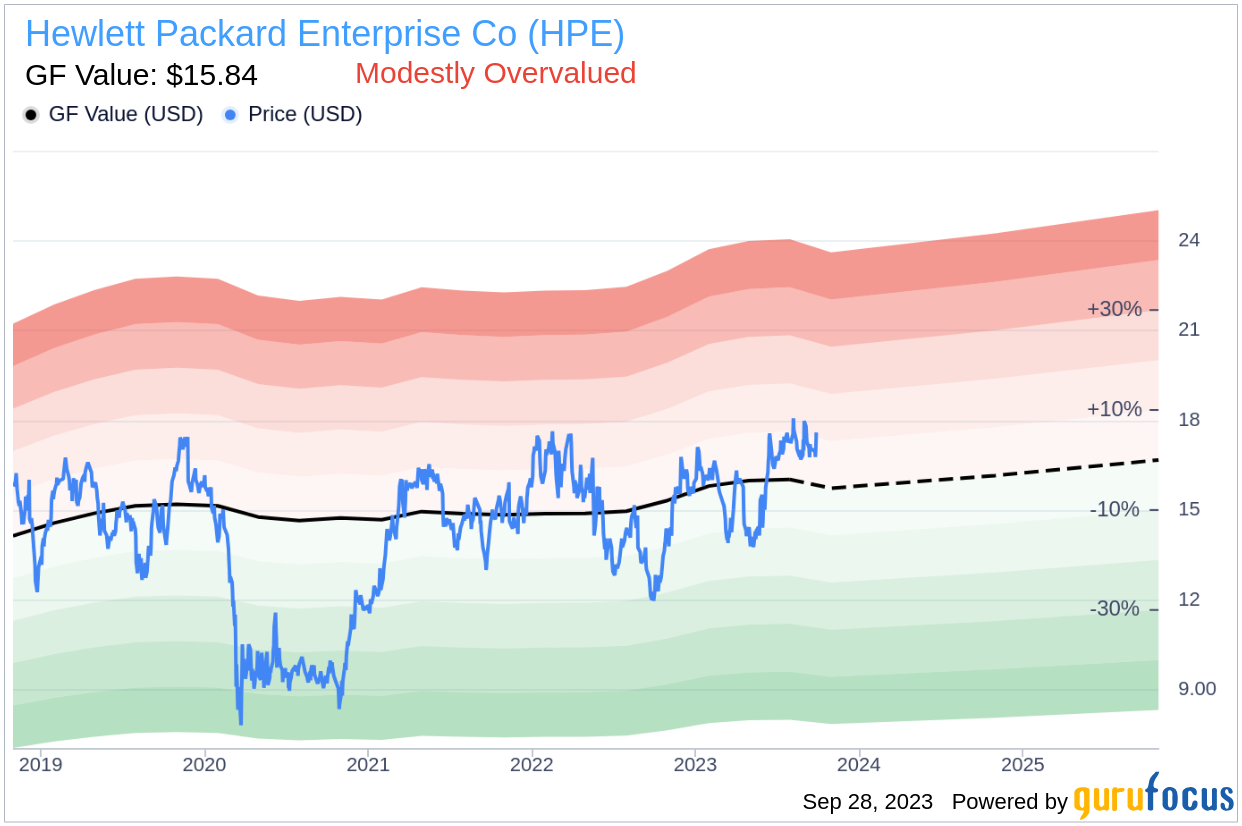
As of the stated date, HPE's stock price stands at $17.6, while the GF Value, an estimation of fair value, is pegged at $15.84. This suggests that the stock may be modestly overvalued. Here's a breakdown of Hewlett Packard Enterprise Co's income:
Understanding the GF Value
The GF Value represents the intrinsic value of a stock, derived from a unique calculation method. The GF Value Line on our summary page provides an overview of the stock's fair value. It is calculated based on three factors:
- Historical multiples (PE Ratio, PS Ratio, PB Ratio, and Price-to-Free-Cash-Flow) at which the stock has traded.
- GuruFocus adjustment factor based on the company's past returns and growth.
- Future estimates of the business performance.
The GF Value Line is deemed to be the stock's fair value. If the stock price significantly exceeds the GF Value Line, it is considered overvalued, and its future return is likely to be poor. Conversely, if it is significantly below the GF Value Line, its future return will likely be higher.
With a current price of $17.6 per share and a market cap of $22.60 billion, Hewlett Packard Enterprise Co appears to be modestly overvalued. As a result, the long-term return of its stock is likely to be lower than its business growth.
Link: These companies may deliever higher future returns at reduced risk.
Financial Strength
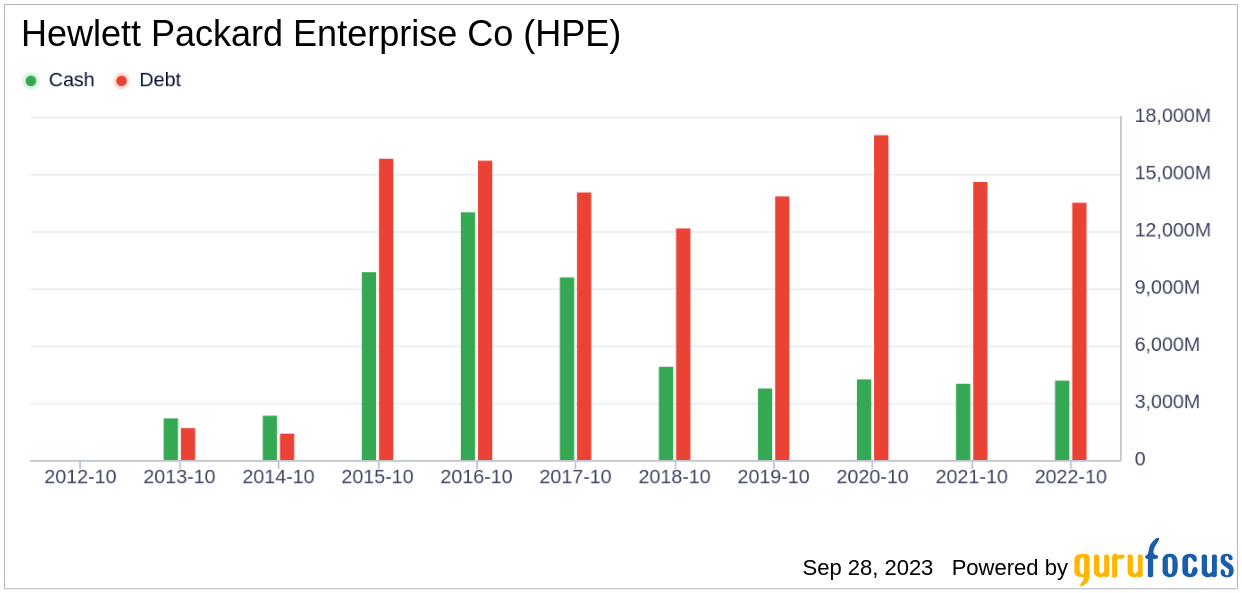
Investing in companies with poor financial strength carries a higher risk of permanent capital loss. Therefore, it's crucial to review a company's financial strength before deciding to invest in its stock. A good starting point is to look at the cash-to-debt ratio and interest coverage. Hewlett Packard Enterprise Co has a cash-to-debt ratio of 0.22, which is worse than 87.1% of 2372 companies in the Hardware industry. GuruFocus ranks the overall financial strength of Hewlett Packard Enterprise Co at 5 out of 10, indicating fair financial strength.
Here's a look at the debt and cash of Hewlett Packard Enterprise Co over the past years:
Profitability and Growth
Investing in profitable companies, especially those with consistent long-term profitability, poses less risk. Companies with high profit margins are typically safer investments than those with low profit margins. Over the past ten years, Hewlett Packard Enterprise Co has been profitable for nine years. In the past twelve months, the company reported a revenue of $29.70 billion and an Earnings Per Share (EPS) of $0.82. Its operating margin is 8.88%, which ranks better than 72.19% of 2456 companies in the Hardware industry. Overall, GuruFocus ranks the profitability of Hewlett Packard Enterprise Co at 7 out of 10, indicating fair profitability.
One of the most critical factors in a company's valuation is its growth. Long-term stock performance is closely correlated with growth, according to GuruFocus research. Companies that grow faster create more value for shareholders, especially if that growth is profitable. The average annual revenue growth of Hewlett Packard Enterprise Co is 0.4%, which ranks worse than 62.14% of 2332 companies in the Hardware industry. The 3-year average EBITDA growth is -4.9%, which ranks worse than 74.96% of 1961 companies in the Hardware industry.
ROIC vs WACC
Another method of determining a company's profitability is to compare its return on invested capital (ROIC) to the weighted average cost of capital (WACC). ROIC measures how well a company generates cash flow relative to the capital it has invested in its business. WACC is the rate that a company is expected to pay on average to all its security holders to finance its assets. When the ROIC is higher than the WACC, it implies the company is creating value for shareholders. For the past 12 months, Hewlett Packard Enterprise Co's ROIC is 4.51, and its WACC is 8.35.
The historical ROIC vs WACC comparison of Hewlett Packard Enterprise Co is shown below: 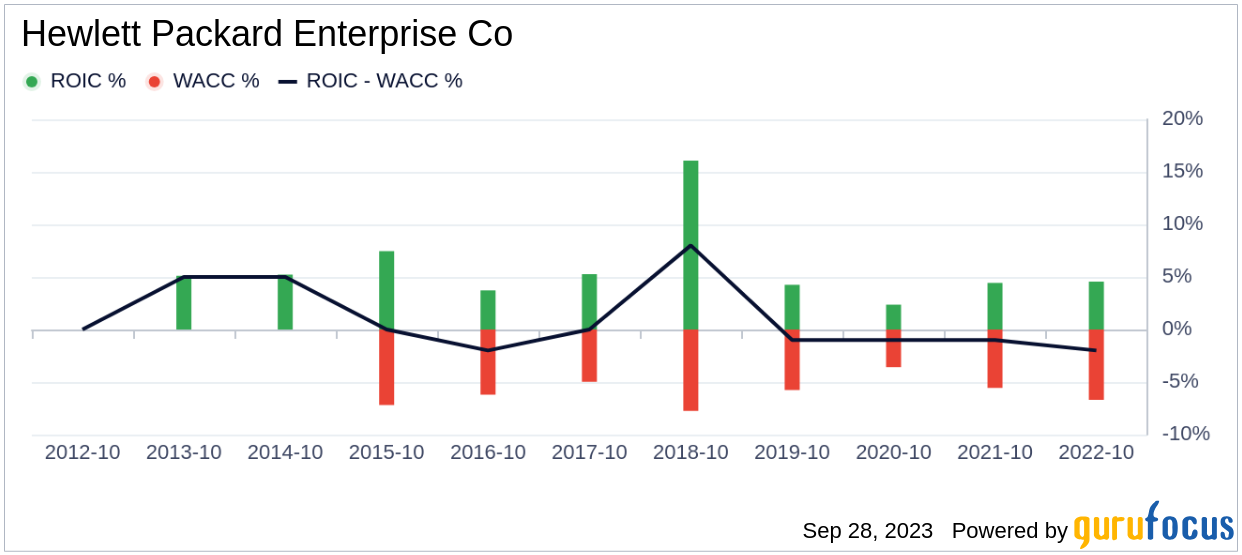
Conclusion
Overall, the stock of Hewlett Packard Enterprise Co (HPE, Financial) seems to be modestly overvalued. The company's financial condition is fair, and its profitability is fair. However, its growth ranks worse than 74.96% of 1961 companies in the Hardware industry. To learn more about Hewlett Packard Enterprise Co stock, you can check out its 30-Year Financials here.
To find out high-quality companies that may deliver above-average returns, please check out GuruFocus High Quality Low Capex Screener.