
Long-established in the Consumer Packaged Goods industry, Kellogg Co (K, Financial) has enjoyed a stellar reputation. However, it has recently witnessed a daily loss of 10.8%, juxtaposed with a three-month change of -20.39%. Fresh insights from the GF Score hint at potential headwinds. Notably, its diminished rankings in financial strength, growth, and valuation suggest that the company might not live up to its historical performance. Join us as we dive deep into these pivotal metrics to unravel the evolving narrative of Kellogg Co.

Understanding the GF Score
The GF Score is a stock performance ranking system developed by GuruFocus using five aspects of valuation, which has been found to be closely correlated to the long-term performances of stocks by backtesting from 2006 to 2021. The stocks with a higher GF Score generally generate higher returns than those with a lower GF Score. Therefore, when picking stocks, investors should invest in companies with high GF Scores. The GF Score ranges from 0 to 100, with 100 as the highest rank.
- Financial strength rank: 5/10
- Profitability rank: 7/10
- Growth rank: 5/10
- GF Value rank: 7/10
- Momentum rank: 1/10
Based on the above method, GuruFocus assigned Kellogg Co the GF Score of 69 out of 100, which signals poor future outperformance potential.
Delving into Kellogg Co's Business
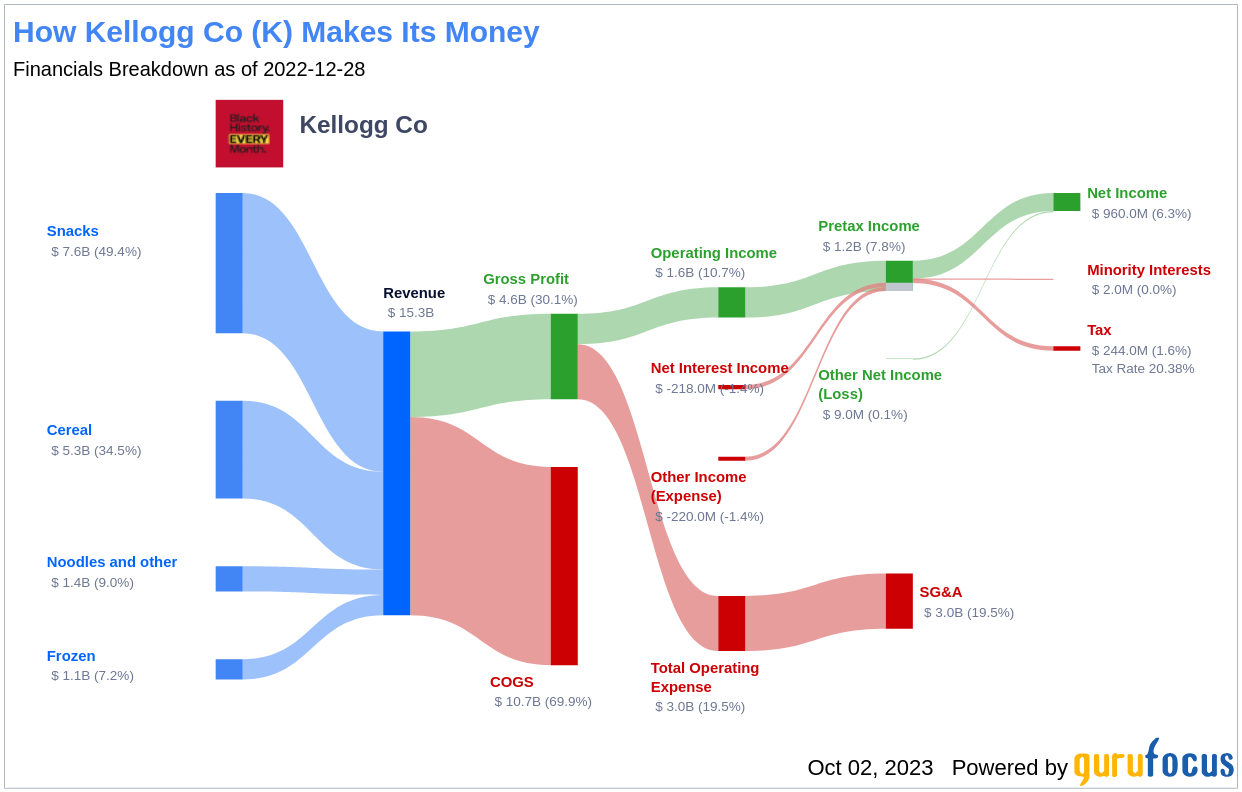
Founded in 1906, Kellogg Co is a leading global manufacturer and marketer of cereal, cookies, crackers, and other packaged foods. With a market cap of $18.17 billion and sales of $15.87 billion, the company operates in 21 countries and markets its products in more than 180 countries. Its product mix includes well-known brands such as Special K, Frosted Flakes, Froot Loops, Rice Krispies, Pop-Tarts, Eggo, Kashi, and Morningstar Farms. The firm added the Pringles brand to its mix in 2012. Sales outside its home turf account for just north of 40% of Kellogg's consolidated sales base. The firm intends to split its global snacking arm from its North American cereal segment by the end of calendar 2023.
Financial Strength Breakdown
Kellogg Co's financial strength indicators present some concerning insights about the company's balance sheet health. The company's Altman Z-Score is just 2.59, which is below the safe threshold of 2.99. Although this does not imply immediate danger of financial distress, the stock may face some financial struggles if the Altman Z-score drops below 1.81. Additionally, the company's low cash-to-debt ratio at 0.04 indicates a struggle in handling existing debt levels. Furthermore, the company's debt-to-Ebitda ratio is 4.01, which is above Joel Tillinghast's warning level of 4 and is worse than 67.23% of 1361 companies in the Consumer Packaged Goods industry. Tillinghast said in his book “Big Money Think's Small: Biases, Blind Spots, and Smarter Investing” that a high debt-to-Ebitda ratio can be a red flag unless tangible assets cover the debt.
Looking Ahead
Given the company's financial strength, profitability, and growth metrics, the GF Score highlights the firm's unparalleled position for potential underperformance. While Kellogg Co has a rich history and a diverse product portfolio, its financial indicators suggest that it may struggle to maintain its past performance. As value investors, it's crucial to consider these factors when making investment decisions.
GuruFocus Premium members can find more companies with strong GF Scores using the following screener link: GF Score Screen