

Value-focused investors are continually seeking stocks trading below their intrinsic value. One such stock warranting attention is Verizon Communications Inc (VZ, Financial). Currently priced at $30.26, the stock recorded a daily loss of 4.91% and a 3-month decrease of 14.99%. The fair valuation of the stock, as indicated by its GF Value, is $51.99.
Understanding the GF Value
The GF Value represents the current intrinsic value of a stock derived from our proprietary method. The GF Value Line provides an overview of the fair value at which the stock should be traded. This value is calculated based on historical multiples (PE Ratio, PS Ratio, PB Ratio, and Price-to-Free-Cash-Flow) that the stock has traded at, GuruFocus adjustment factor based on the company's past returns and growth, and future estimates of the business performance.
If the stock price is significantly above the GF Value Line, it is overvalued, and its future return is likely to be poor. On the other hand, if it is significantly below the GF Value Line, its future return will likely be higher.
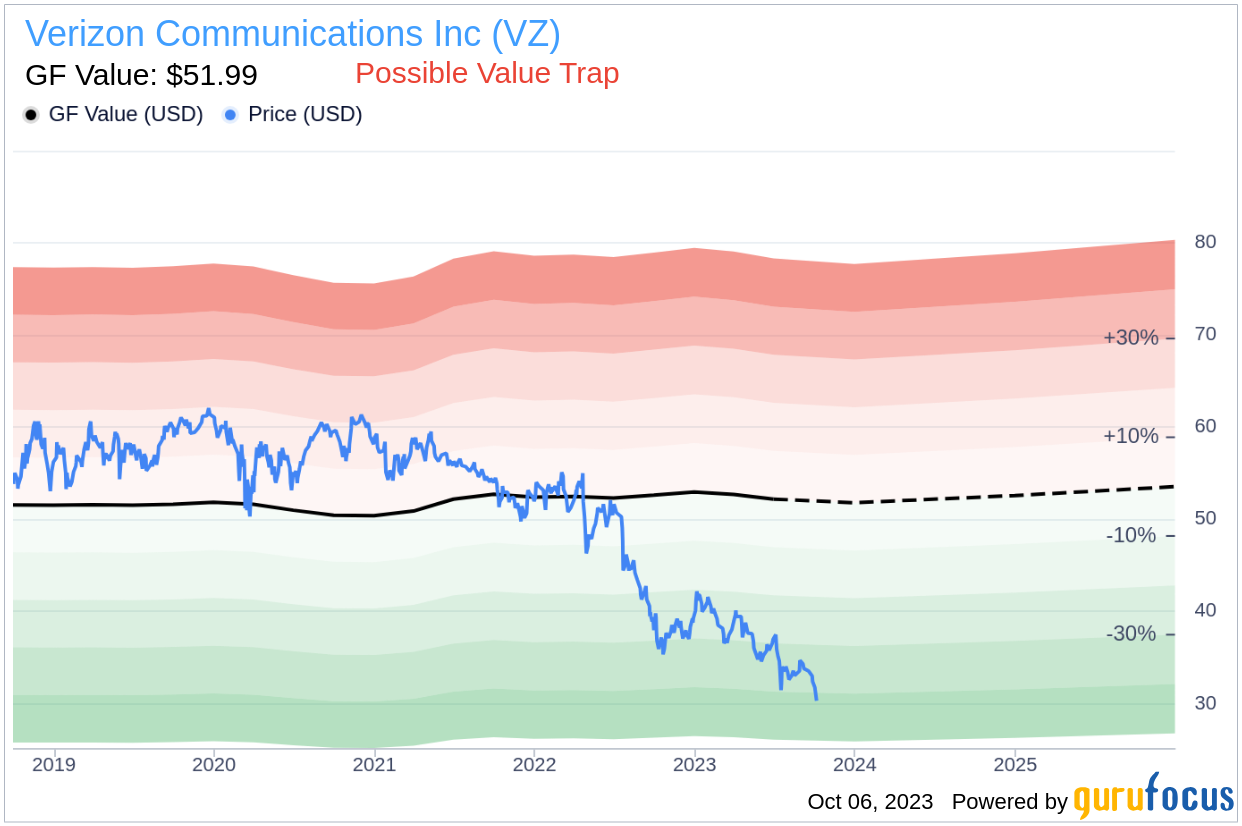
Verizon Communications: A Potential Value Trap?
Despite its seemingly attractive valuation, certain risk factors associated with Verizon Communications should not be overlooked. These risks are primarily reflected through its low Altman Z-score of 1.19. These indicators suggest that Verizon Communications, despite its apparent undervaluation, might be a potential value trap. This complexity underlines the importance of thorough due diligence in investment decision-making.
Deciphering the Altman Z-Score
Invented by New York University Professor Edward I. Altman in 1968, the Z-Score is a financial model that predicts the probability of a company entering bankruptcy within a two-year time frame. The Altman Z-Score combines five different financial ratios, each weighted to create a final score. A score below 1.8 suggests a high likelihood of financial distress, while a score above 3 indicates a low risk.
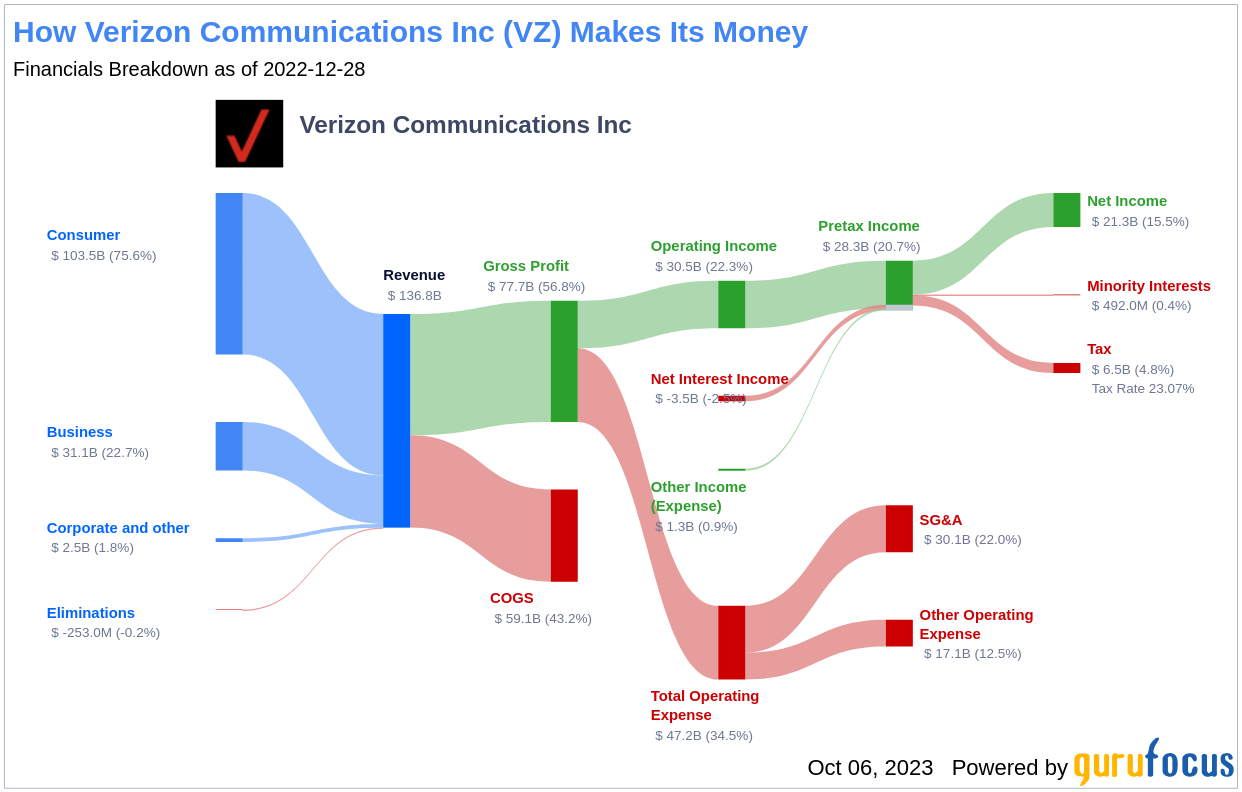
Company Overview
Verizon Communications is primarily a wireless business, providing about 70% of service revenue and nearly all operating income. It serves about 92 million postpaid and 22 million prepaid phone customers via its nationwide network, making it the largest U.S. wireless carrier. Fixed-line telecom operations include local networks in the Northeast, which reach about 25 million homes and businesses and serve about 8 million broadband customers. Verizon also provides telecom services nationwide to enterprise customers.
Verizon Communications's Low Altman Z-Score: A Breakdown of Key Drivers
A dissection of Verizon Communications's Altman Z-score reveals Verizon Communications's financial health may be weak, suggesting possible financial distress:
Operational Efficiency: The Asset Turnover Ratio
A vital indicator for Verizon Communications is its asset turnover. The data from the past three years suggests a decreasing trend in this ratio: 2021: 0.41; 2022: 0.37; 2023: 0.36. The asset turnover ratio reflects how effectively a company is using its assets to generate sales. A drop in this ratio can signify reduced operational efficiency, potentially due to underutilization of assets or decreased market demand for the company's products or services. This shift in Verizon Communications's asset turnover underlines the need for the company to reassess its operational strategies to optimize asset usage and boost sales.
Conclusion
Verizon Communications Inc (VZ, Financial), despite its attractive valuation, exhibits signs of being a potential value trap. The company's low Altman Z-Score and decreasing asset turnover ratio suggest potential financial distress and declining operational efficiency. Therefore, it is crucial for investors to conduct thorough due diligence before making an investment decision.
GuruFocus Premium members can find stocks with high Altman Z-Score using the following Screener: Walter Schloss Screen .
This article, generated by GuruFocus, is designed to provide general insights and is not tailored financial advice. Our commentary is rooted in historical data and analyst projections, utilizing an impartial methodology, and is not intended to serve as specific investment guidance. It does not formulate a recommendation to purchase or divest any stock and does not consider individual investment objectives or financial circumstances. Our objective is to deliver long-term, fundamental data-driven analysis. Be aware that our analysis might not incorporate the most recent, price-sensitive company announcements or qualitative information. GuruFocus holds no position in the stocks mentioned herein.