

The stock of Nasdaq Inc (NDAQ, Financial) has seen a daily gain of 4.69% and a 3-month gain of 2.21%. The company has an Earnings Per Share (EPS) of 2.22. But is the stock modestly overvalued? This article provides a detailed valuation analysis to answer this question.
Company Overview
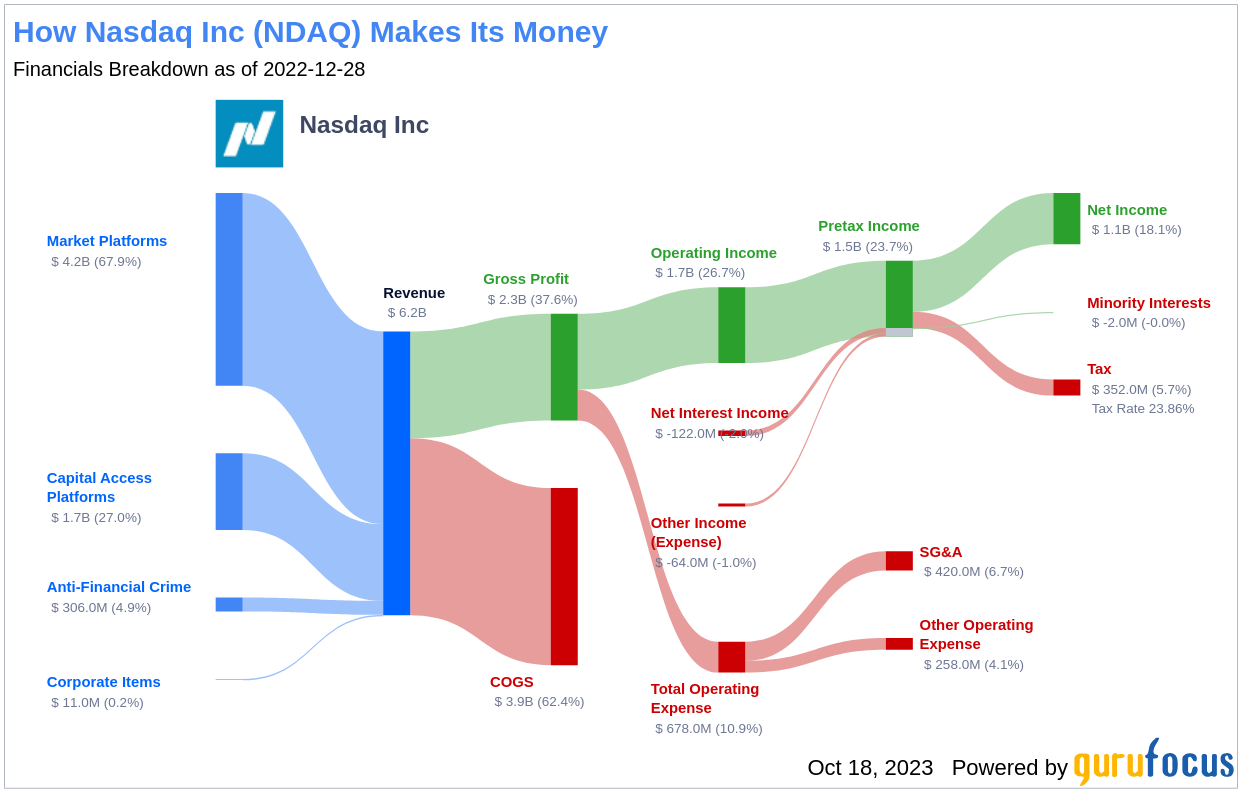
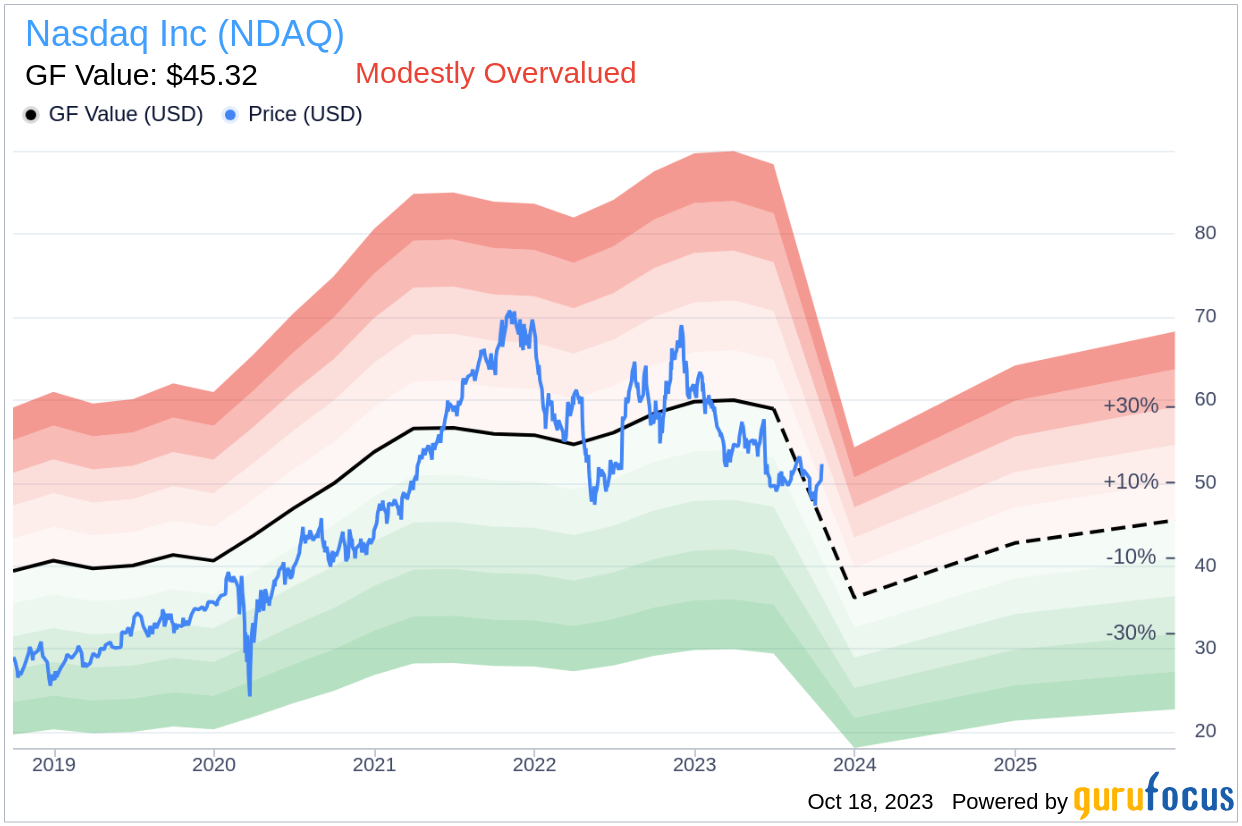
Founded in 1971, Nasdaq is primarily known for its equity exchange. The company's business operations include market-services business, selling and distributing market data, offering Nasdaq-branded indexes to asset managers and investors, listing services, and related investor relations products. Nasdaq also facilitates the exchange operations of other exchanges worldwide and provides financial compliance services. The current stock price stands at $52.27, and the GF Value, an estimation of fair value, is $45.32.
Understanding GF Value
The GF Value is a proprietary measure of a stock's intrinsic value. It takes into account historical trading multiples, a GuruFocus adjustment factor based on past performance and growth, and future business performance estimates. The GF Value Line denotes the stock's ideal fair trading value. If the stock price is significantly above the GF Value Line, it is overvalued, and its future return is likely to be poor. Conversely, if it is significantly below the GF Value Line, its future return will likely be higher.
According to GuruFocus Value calculation, Nasdaq (NDAQ, Financial) appears to be modestly overvalued. With its current price of $52.27 per share and the market cap of $25.70 billion, the stock's long-term return is likely to be lower than its business growth.
Link: These companies may deliver higher future returns at reduced risk.
Financial Strength
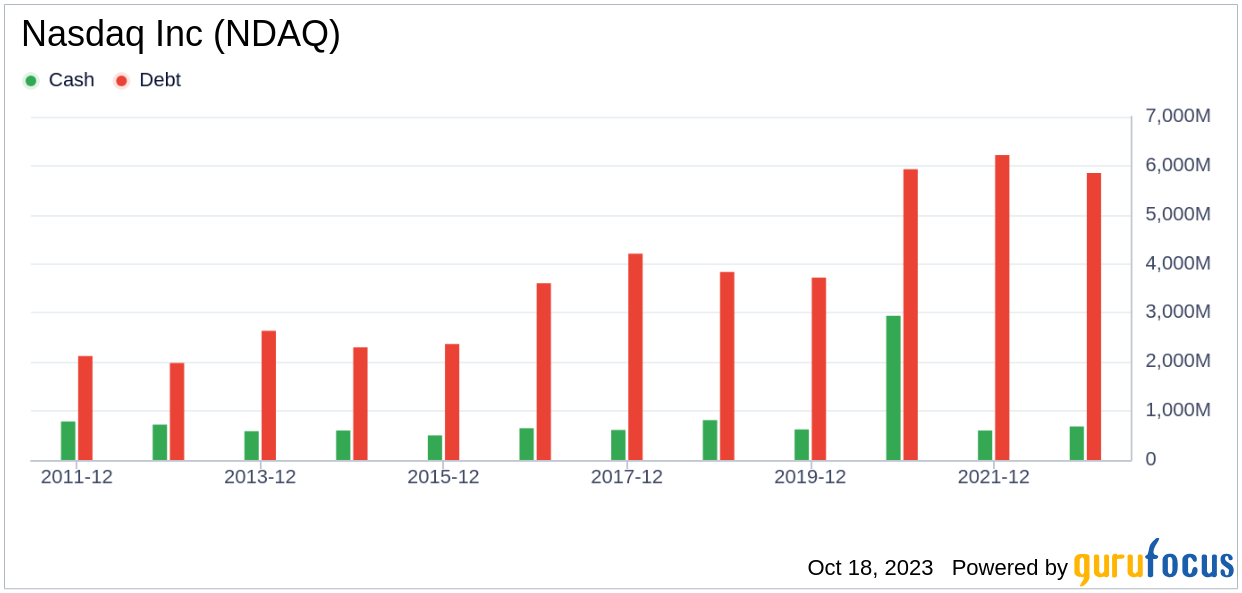
Investing in companies with low financial strength could result in permanent capital loss, so it's essential to review a company's financial strength before buying shares. Nasdaq has a cash-to-debt ratio of 0.54, ranking worse than 73.77% of 755 companies in the Capital Markets industry. GuruFocus ranks Nasdaq's financial strength as 5 out of 10, suggesting a fair balance sheet.
Profitability and Growth
Profitable companies, especially those with consistent profitability over the long term, pose less risk. Nasdaq has been profitable for 10 out of the past 10 years. The company has a revenue of $6.10 billion and an Earnings Per Share (EPS) of $2.22. Its operating margin is 27.68%, ranking better than 69.5% of 646 companies in the Capital Markets industry. GuruFocus ranks Nasdaq's profitability at 8 out of 10.
Growth is a crucial factor in the valuation of a company. The 3-year average annual revenue growth rate of Nasdaq is 13.7%, ranking better than 63.37% of 677 companies in the Capital Markets industry. However, the 3-year average EBITDA growth rate is 12.1%, ranking worse than 51.28% of 470 companies in the Capital Markets industry.
ROIC vs WACC
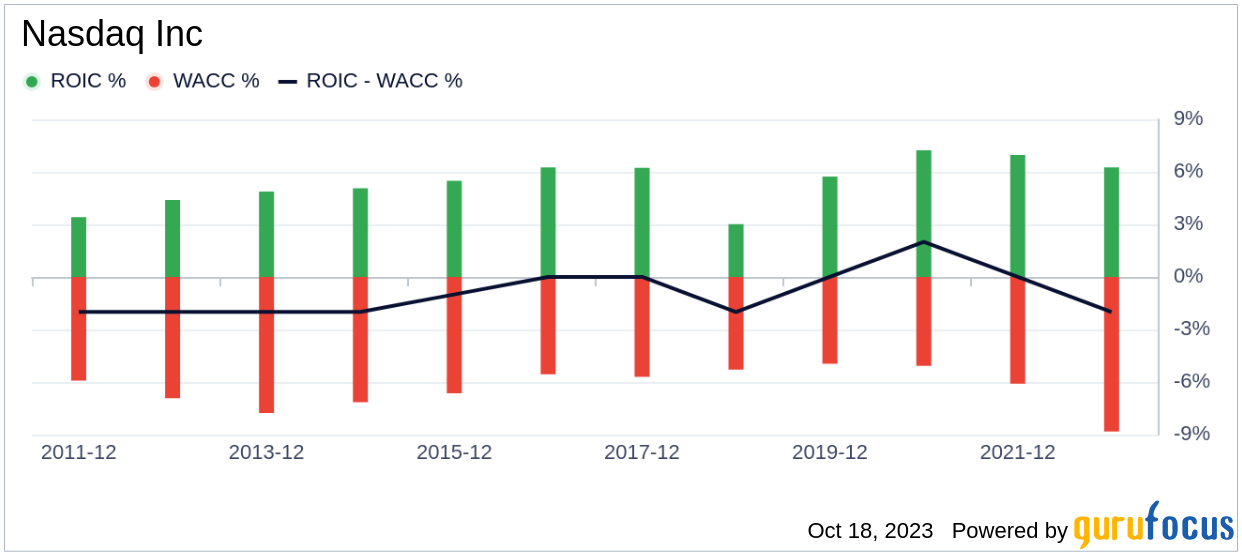
Comparing a company's return on invested capital (ROIC) to its weighted average cost of capital (WACC) can also evaluate a company's profitability. ROIC measures how well a company generates cash flow relative to the capital it has invested in its business. WACC is the rate that a company is expected to pay on average to all its security holders to finance its assets. If the ROIC exceeds the WACC, the company is likely creating value for its shareholders. During the past 12 months, Nasdaq's ROIC was 6.08, while its WACC came in at 8.71.
Conclusion
In summary, the stock of Nasdaq (NDAQ, Financial) appears to be modestly overvalued. The company's financial condition is fair, and its profitability is strong. However, its growth ranks worse than 51.28% of 470 companies in the Capital Markets industry. To learn more about Nasdaq stock, you can check out its 30-Year Financials here.
To find out the high-quality companies that may deliver above-average returns, please check out GuruFocus High Quality Low Capex Screener.
This article, generated by GuruFocus, is designed to provide general insights and is not tailored financial advice. Our commentary is rooted in historical data and analyst projections, utilizing an impartial methodology, and is not intended to serve as specific investment guidance. It does not formulate a recommendation to purchase or divest any stock and does not consider individual investment objectives or financial circumstances. Our objective is to deliver long-term, fundamental data-driven analysis. Be aware that our analysis might not incorporate the most recent, price-sensitive company announcements or qualitative information. GuruFocus holds no position in the stocks mentioned herein.