

As of October 19, 2023, Netflix Inc (NFLX, Financial) experienced a daily gain of 16.2%, despite a 3-month loss of -16.07%. The company's Earnings Per Share (EPS) stands at 9.39. The question many investors might be asking is, "Is the stock modestly undervalued?" This article aims to provide a comprehensive valuation analysis to answer this question. Let's dive into the details.
Introduction to Netflix Inc (NFLX, Financial)
Netflix Inc (NFLX) is a global leader in the streaming video-on-demand service, available in almost every country except China. The firm's primary revenue comes from subscriptions to its service. Netflix delivers original and third-party digital video content to PCs, internet-connected TVs, and consumer electronic devices, including tablets, video game consoles, Apple TV, Roku, and Chromecast. With over 220 million subscribers worldwide, Netflix is the largest SVOD platform globally.
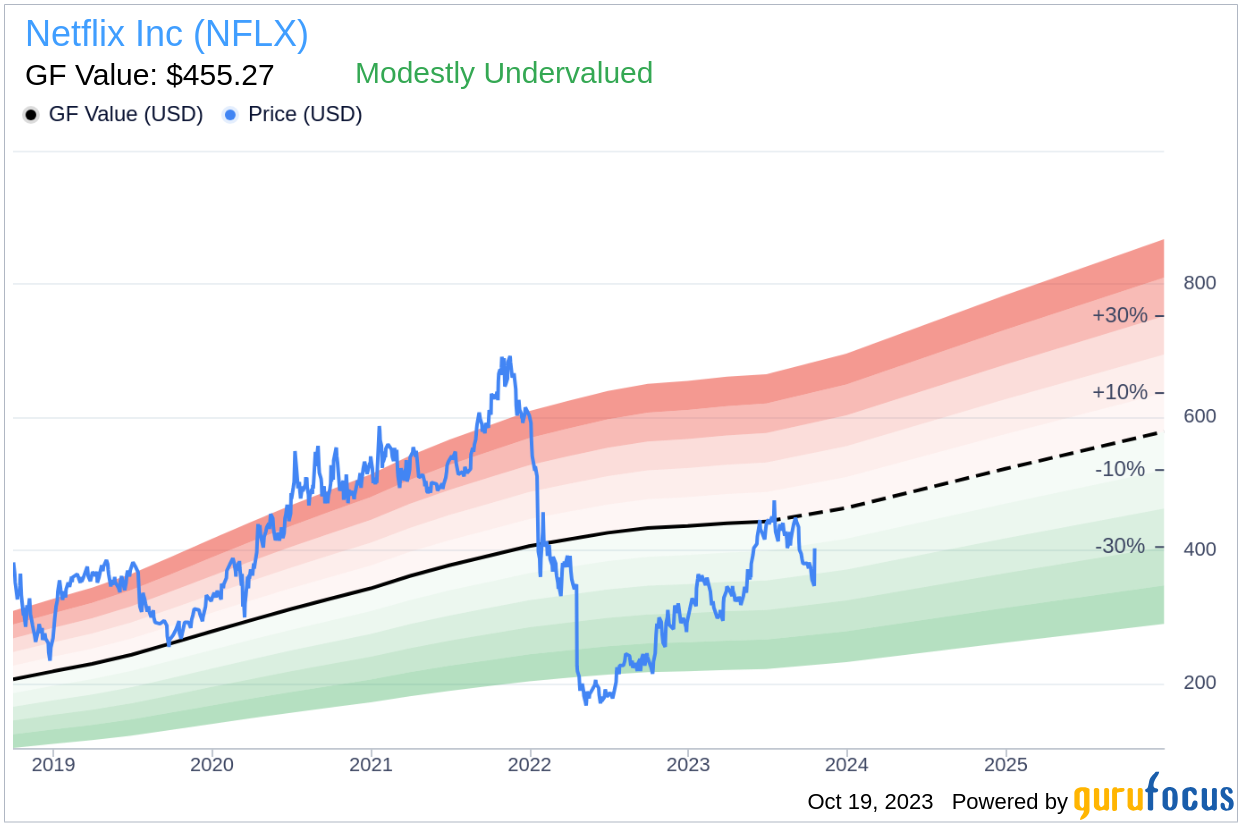
As of the date of this analysis, Netflix's stock price stands at $402.27. When compared to its GF Value of $455.27, the stock appears to be modestly undervalued. This conclusion is based on various factors, including historical trading multiples, past performance, and future business performance estimates. The 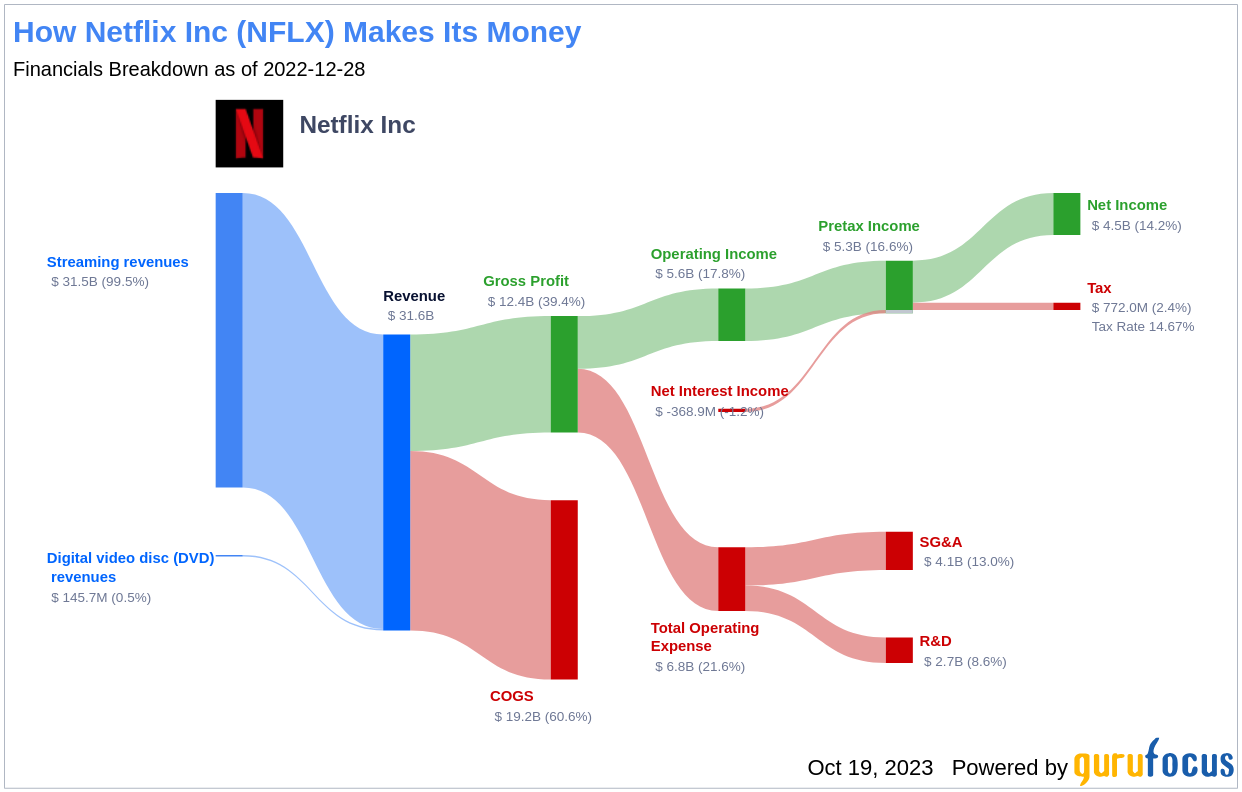 provides an insight into the income breakdown of Netflix.
A Close Look at the GF Value of Netflix (NFLX, Financial)
The GF Value is a proprietary valuation model that takes into consideration historical trading multiples, a GuruFocus adjustment factor based on past performance and growth, and future business performance estimates. The GF Value Line represents the fair value at which the stock should ideally be trading. If the stock price is significantly above the GF Value Line, it is overvalued, and its future return is likely to be poor. Conversely, if it is significantly below the GF Value Line, its future return will likely be higher.
Considering these factors, Netflix (NFLX, Financial) appears to be modestly undervalued at its current price of $402.27 per share. With a market cap of $178.30 billion, the long-term return of its stock is likely to be higher than its business growth because it is relatively undervalued.
For a list of companies that may deliver higher future returns at reduced risk, click here.
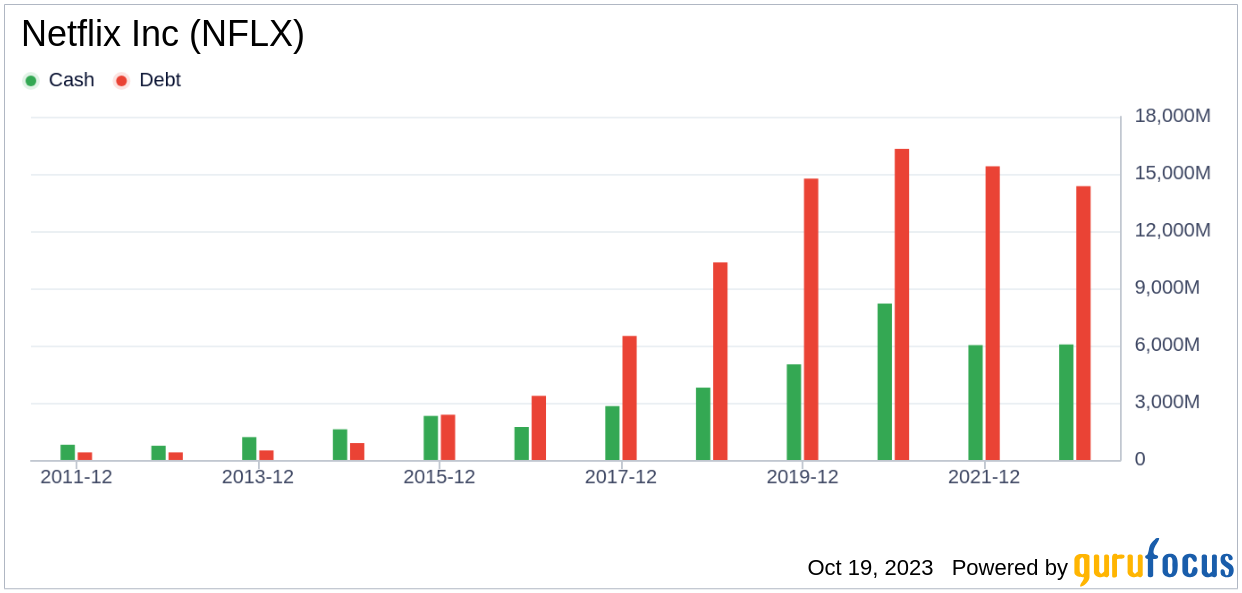
Assessing Netflix's Financial Strength
Investing in companies with low financial strength could result in permanent capital loss. Therefore, it's crucial to review a company's financial strength before investing. Netflix has a cash-to-debt ratio of 0.51, which ranks worse than 61.91% of 1003 companies in the Media - Diversified industry. Based on this, GuruFocus ranks Netflix's financial strength as 7 out of 10, suggesting a fair balance sheet.
Profitability and Growth of Netflix
Investing in profitable companies, especially those that have demonstrated consistent profitability over the long term, poses less risk. Netflix has been profitable 10 over the past 10 years. Over the past twelve months, the company had a revenue of $32.10 billion and Earnings Per Share (EPS) of $9.39. Its operating margin is 17.51%, which ranks better than 86.89% of 1030 companies in the Media - Diversified industry. Overall, GuruFocus ranks the profitability of Netflix at 9 out of 10, which indicates strong profitability.
Growth is a significant factor in the valuation of a company. GuruFocus' research has found that growth is closely correlated with the long-term performance of a company's stock. Netflix's 3-year average revenue growth rate is better than 84.32% of 950 companies in the Media - Diversified industry. Netflix's 3-year average EBITDA growth rate is 19.2%, which ranks better than 70.37% of 766 companies in the Media - Diversified industry.
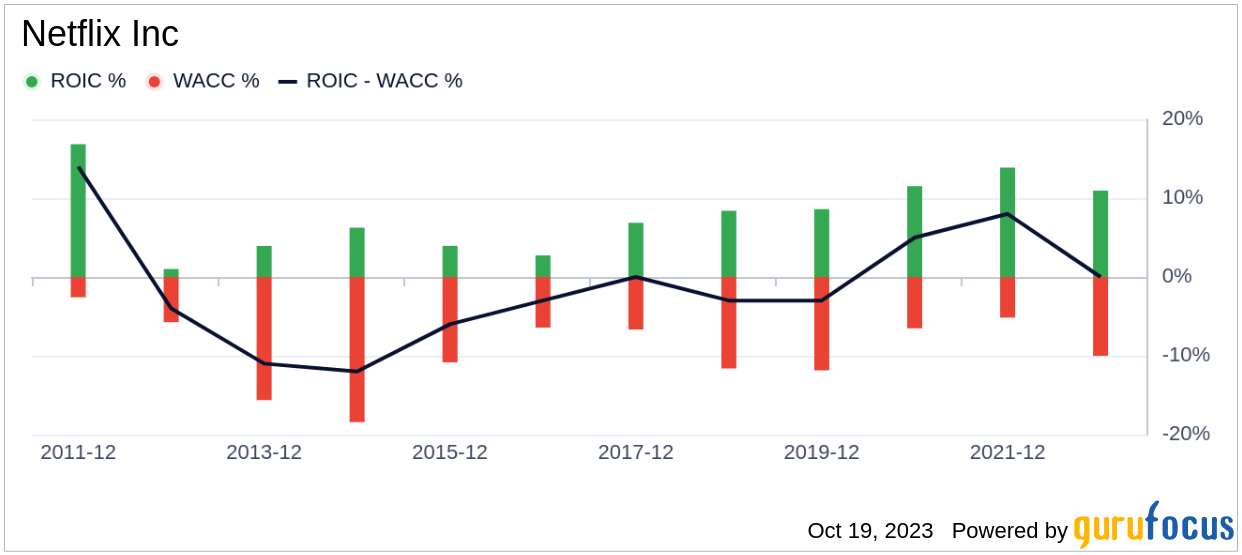
ROIC vs WACC
Comparing a company's return on invested capital (ROIC) to its weighted cost of capital (WACC) is another way to evaluate its profitability. Return on invested capital (ROIC) measures how well a company generates cash flow relative to the capital it has invested in its business. The weighted average cost of capital (WACC) is the rate that a company is expected to pay on average to all its security holders to finance its assets. If the ROIC is higher than the WACC, it indicates that the company is creating value for shareholders. Over the past 12 months, Netflix's ROIC was 11.09, while its WACC came in at 14.03.
Conclusion
In conclusion, the stock of Netflix (NFLX, Financial) appears to be modestly undervalued. The company's financial condition is fair, and its profitability is strong. Its growth ranks better than 70.37% of 766 companies in the Media - Diversified industry. To learn more about Netflix stock, you can check out its 30-Year Financials here.
To find out the high-quality companies that may deliver above-average returns, please check out GuruFocus High Quality Low Capex Screener.
This article, generated by GuruFocus, is designed to provide general insights and is not tailored financial advice. Our commentary is rooted in historical data and analyst projections, utilizing an impartial methodology, and is not intended to serve as specific investment guidance. It does not formulate a recommendation to purchase or divest any stock and does not consider individual investment objectives or financial circumstances. Our objective is to deliver long-term, fundamental data-driven analysis. Be aware that our analysis might not incorporate the most recent, price-sensitive company announcements or qualitative information. GuruFocus holds no position in the stocks mentioned herein.