

On October 31, 2023, Danaher Corp (DHR, Financial) witnessed a daily gain of 4.4%, despite a 3-month loss of 15.4%. The Earnings Per Share (EPS) (EPS) stood at 7.93, raising questions about the stock's valuation. Is it modestly undervalued as our analysis suggests? Read on for a detailed valuation analysis of Danaher.
A Brief Overview of Danaher Corp (DHR, Financial)
In 1984, Danaher's founders transformed a real estate organization into an industrial-focused manufacturing company. Through a series of mergers, acquisitions, and divestitures, Danaher now focuses primarily on manufacturing scientific instruments and consumables in two segments--life sciences and diagnostics--after the late 2023 divestiture of its environmental and applied solutions group, Veralto. With a market cap of $142.80 billion and sales of $29.60 billion, the company's stock price stands at $193.25, which is less than the GF Value of $231.75.

Understanding the GF Value of Danaher Corp (DHR, Financial)
The GF Value is an estimation of a stock's intrinsic value based on historical multiples, an internal adjustment factor, and future business performance estimates. The GF Value Line on our summary page provides an overview of the fair value at which the stock should ideally trade. If the stock price is significantly above the GF Value Line, it is overvalued, and its future return is likely to be poor. Conversely, if it is significantly below the GF Value Line, its future return will likely be higher.
According to our valuation method, Danaher (DHR, Financial) appears to be modestly undervalued. This suggests that the long-term return of its stock is likely to be higher than its business growth.

Link: These companies may deliver higher future returns at reduced risk.
Assessing Danaher's Financial Strength
Investing in companies with poor financial strength exposes investors to a high risk of permanent capital loss. To avoid this, it's crucial to review a company's financial strength before purchasing shares. Danaher's cash-to-debt ratio is 0.56, ranking worse than 64.16% of 226 companies in the Medical Diagnostics & Research industry. However, its overall financial strength is 7 out of 10, indicating fair financial health.

Danaher's Profitability and Growth
Investing in profitable companies carries less risk, especially those with consistent profitability over the long term. Danaher has been profitable 10 years over the past 10 years, with revenues of $29.60 billion and Earnings Per Share (EPS) of $7.93 in the past 12 months. Its operating margin of 23.53% is better than 91.19% of 227 companies in the Medical Diagnostics & Research industry. Overall, Danaher's profitability is strong.
Growth is a critical factor in the valuation of a company. Danaher's 3-year average annual revenue growth rate is 20%, ranking better than 69.15% of 201 companies in the Medical Diagnostics & Research industry. The 3-year average EBITDA growth rate is 31.9%, ranking better than 75% of 184 companies in the same industry.
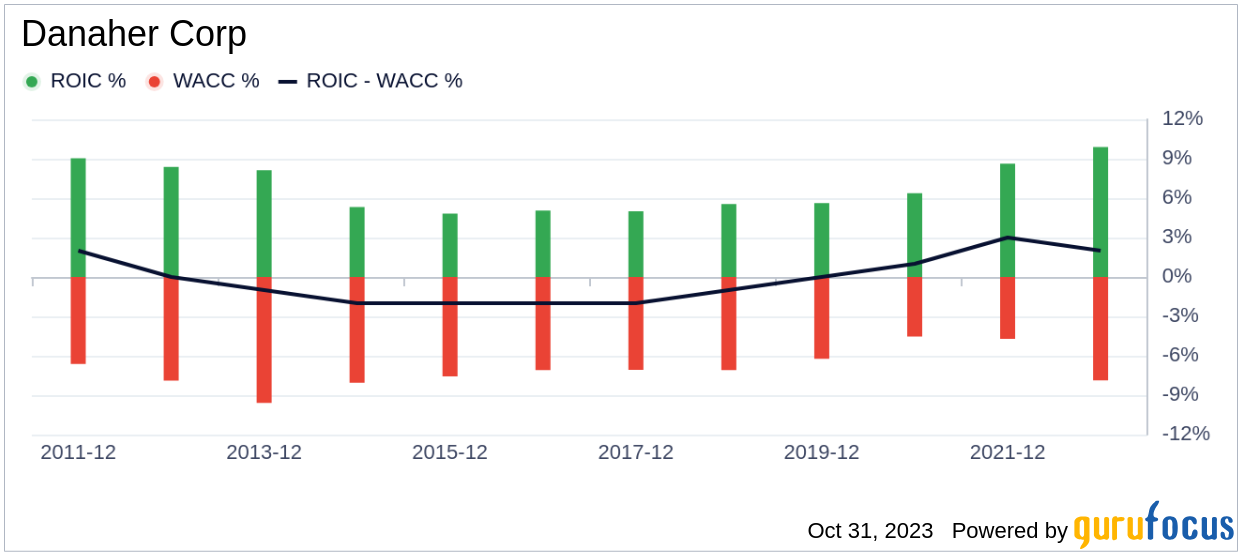
Comparing ROIC and WACC
Return on invested capital (ROIC) and weighted average cost of capital (WACC) are useful metrics to evaluate a company's profitability. If ROIC exceeds WACC, the company is likely creating value for its shareholders. Danaher's ROIC stands at 8.6 while its WACC is at 8.05, indicating a positive value creation.
Conclusion
In conclusion, Danaher (DHR, Financial) appears to be modestly undervalued. The company's financial condition is fair, its profitability is strong, and its growth ranks better than 75% of companies in the Medical Diagnostics & Research industry. To learn more about Danaher stock, check out its 30-Year Financials here.
To find out the high quality companies that may deliver above-average returns, please check out GuruFocus High Quality Low Capex Screener.
This article, generated by GuruFocus, is designed to provide general insights and is not tailored financial advice. Our commentary is rooted in historical data and analyst projections, utilizing an impartial methodology, and is not intended to serve as specific investment guidance. It does not formulate a recommendation to purchase or divest any stock and does not consider individual investment objectives or financial circumstances. Our objective is to deliver long-term, fundamental data-driven analysis. Be aware that our analysis might not incorporate the most recent, price-sensitive company announcements or qualitative information. GuruFocus holds no position in the stocks mentioned herein.