

Value-focused investors are always on the hunt for stocks that are priced below their intrinsic value. One such stock that merits attention is Warner Bros. Discovery Inc (WBD, Financial). The stock, which is currently priced at 11.08, recorded a gain of 9.92% in a day and a 3-month decrease of 11.71%. The stock's fair valuation is $23.67, as indicated by its GF Value.
Understanding the GF Value
The GF Value represents the current intrinsic value of a stock derived from our exclusive method. The GF Value Line on our summary page gives an overview of the fair value that the stock should be traded at. It is calculated based on historical multiples, GuruFocus adjustment factor, and future estimates of the business performance.
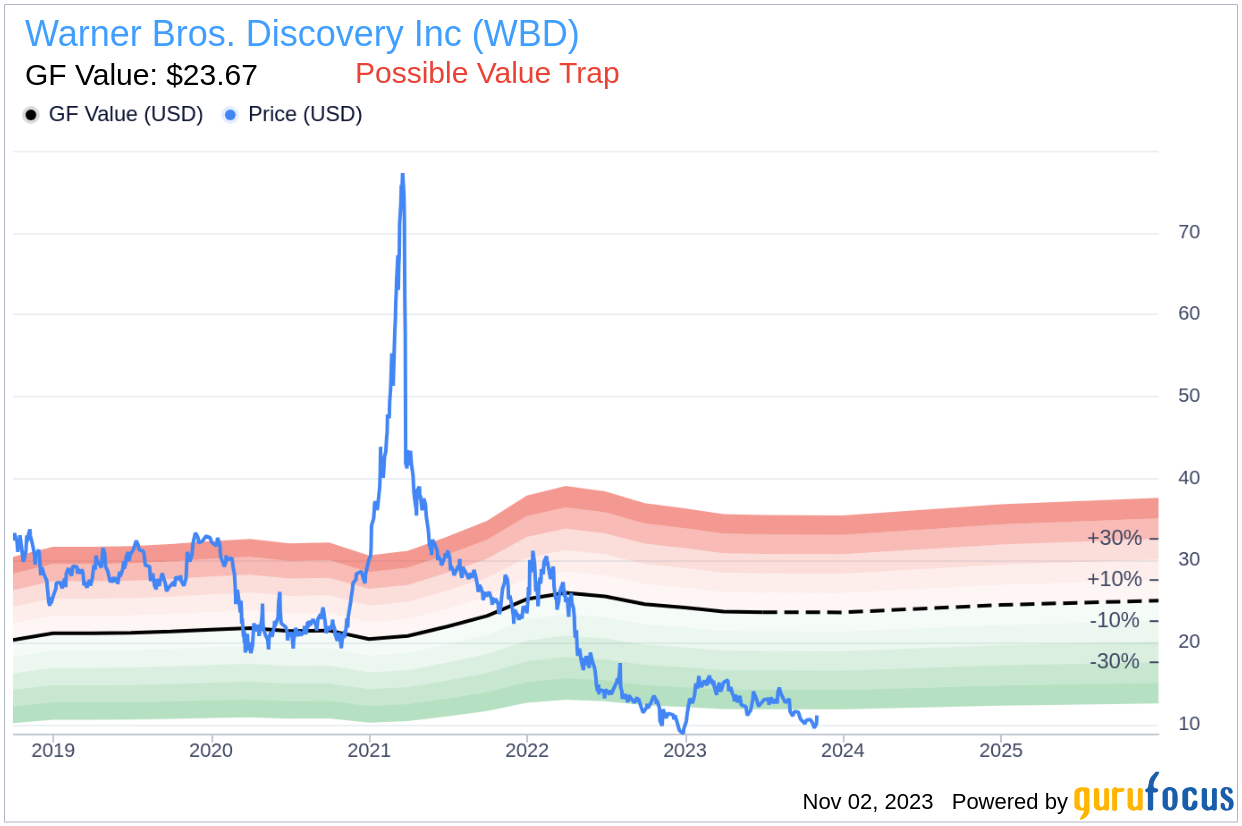
However, investors need to consider a more in-depth analysis before making an investment decision. Despite its seemingly attractive valuation, certain risk factors associated with Warner Bros. Discovery should not be ignored. These risks are primarily reflected through its low Altman Z-score of 0.33. These indicators suggest that Warner Bros. Discovery, despite its apparent undervaluation, might be a potential value trap. This complexity underlines the importance of thorough due diligence in investment decision-making.
The Altman Z-Score: A Closer Look
Before delving into the details, let's understand what the Altman Z-score entails. Invented by New York University Professor Edward I. Altman in 1968, the Z-Score is a financial model that predicts the probability of a company entering bankruptcy within a two-year time frame. The Altman Z-Score combines five different financial ratios, each weighted to create a final score. A score below 1.8 suggests a high likelihood of financial distress, while a score above 3 indicates a low risk.
Introducing Warner Bros. Discovery Inc
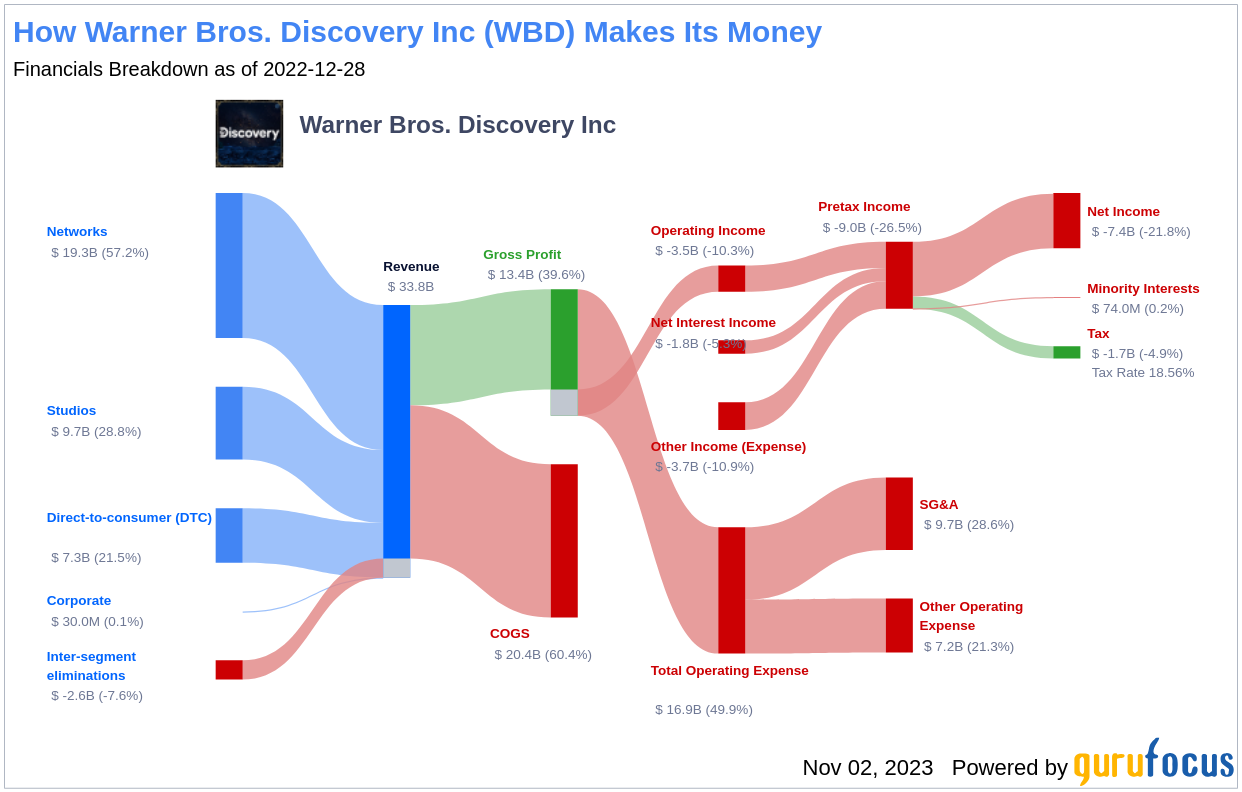
Warner Bros. Discovery, the result of combining two large media firms, is one of the largest media firms in the world with tremendous scale and reach. The new company owns some of the biggest global networks including HBO, Discovery, CNN, and TLC and well-known franchises like Superman, Rick and Morty, and Game of Thrones. The firm's content production studios include Warner Bros., HBO, Discovery Studios, DC Films, and Cartoon Network Studios. The company operates two major streaming services, Max and Discovery+.
Warner Bros. Discovery's Low Altman Z-Score: A Breakdown of Key Drivers
A dissection of Warner Bros. Discovery's Altman Z-score reveals Warner Bros. Discovery's financial health may be weak, suggesting possible financial distress. The Retained Earnings to Total Assets ratio provides insights into a company's capability to reinvest its profits or manage debt. Evaluating Warner Bros. Discovery's historical data, 2021: 0.27; 2022: 0.05; 2023: 0.00, we observe a declining trend in this ratio. This downward movement indicates Warner Bros. Discovery's diminishing ability to reinvest in its business or effectively manage its debt. Consequently, it exerts a negative impact on its Z-Score.
The EBIT to Total Assets ratio serves as a crucial barometer of a company's operational effectiveness, correlating earnings before interest and taxes (EBIT) to total assets. An analysis of Warner Bros. Discovery's EBIT to Total Assets ratio from historical data (2021: 0.07; 2022: -0.02; 2023: -0.05) indicates a descending trend. This reduction suggests that Warner Bros. Discovery might not be utilizing its assets to their full potential to generate operational profits, which could be negatively affecting the company's overall Z-score.
Conclusion
While Warner Bros. Discovery's stock may seem undervalued, the company's low Altman Z-score and declining financial ratios suggest potential financial distress. Therefore, despite its apparent attractiveness, Warner Bros. Discovery might be a potential value trap. It is crucial for investors to conduct thorough due diligence before making investment decisions.
GuruFocus Premium members can find stocks with high Altman Z-Score using the following Screener: Walter Schloss Screen .
This article, generated by GuruFocus, is designed to provide general insights and is not tailored financial advice. Our commentary is rooted in historical data and analyst projections, utilizing an impartial methodology, and is not intended to serve as specific investment guidance. It does not formulate a recommendation to purchase or divest any stock and does not consider individual investment objectives or financial circumstances. Our objective is to deliver long-term, fundamental data-driven analysis. Be aware that our analysis might not incorporate the most recent, price-sensitive company announcements or qualitative information. GuruFocus holds no position in the stocks mentioned herein.