

Value-focused investors are always on the hunt for stocks that are priced below their intrinsic value. One such stock that merits attention is Illumina Inc (ILMN, Financial). The stock, which is currently priced at $98.37, recorded a loss of 8.05% in a day and a 3-month decrease of 46.86%. The stock's fair valuation is $340.74, as indicated by its GF Value.
Understanding GF Value
The GF Value is a unique valuation metric that represents the intrinsic value of a stock. It is calculated by considering historical trading multiples such as PE, PS, PB Ratios, and Price-to-Free-Cash-Flow, adjusted for the company's past performance and future business estimates. While the GF Value Line suggests a fair trading value, significant deviations from this line can indicate overvaluation or undervaluation, influencing future returns.
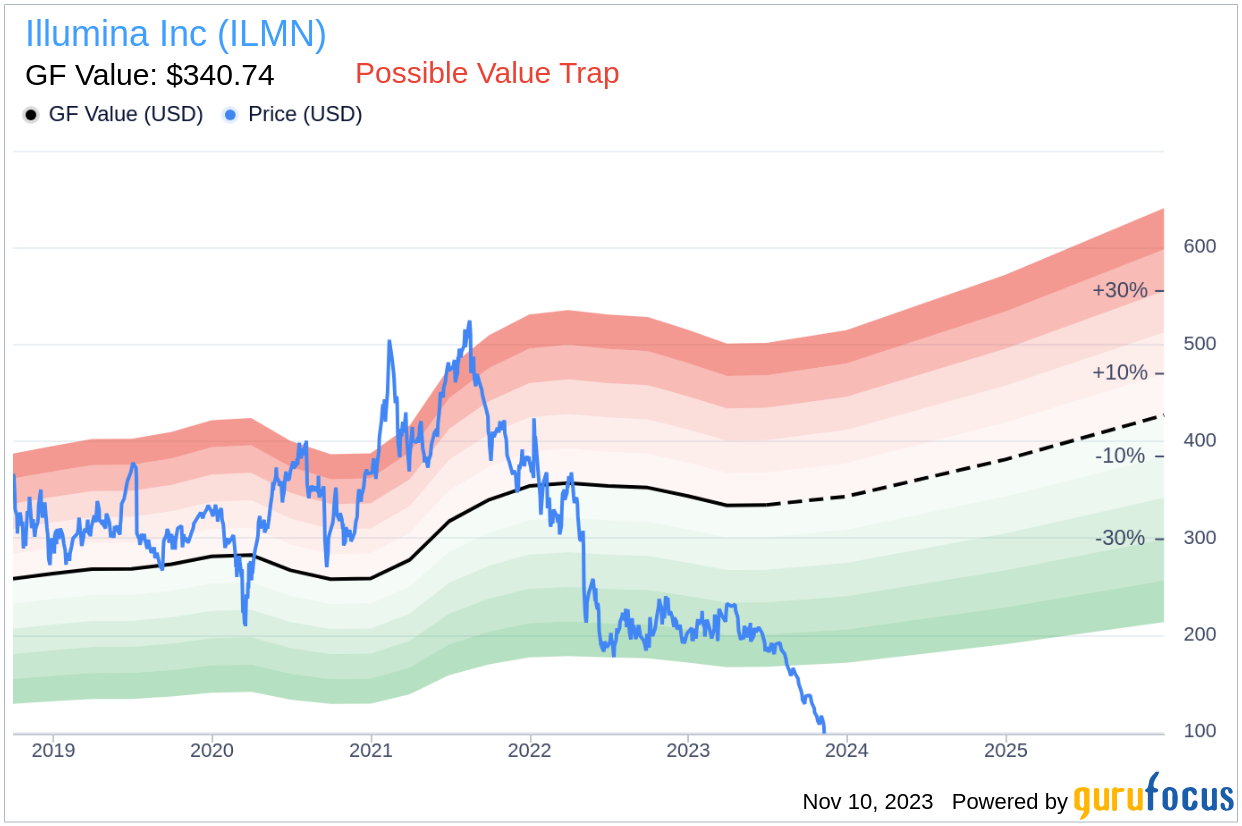
However, investors need to consider a more in-depth analysis before making an investment decision. Despite its seemingly attractive valuation, certain risk factors associated with Illumina should not be ignored. These risks are primarily reflected through its low Altman Z-score of 1.42, suggesting that Illumina, despite its apparent undervaluation, might be a potential value trap. This complexity underlines the importance of thorough due diligence in investment decision-making.
Financial Health Indicators
The Piotroski F-score assesses a company's financial health across nine criteria, with higher scores indicating better financial stability. Illumina's low F-Score points to potential financial weaknesses. The Altman Z-score, another vital financial model, predicts bankruptcy risk, with scores below 1.8 signaling financial distress. Illumina's Z-score falls into this risky category, which is a red flag for investors.
Company Overview
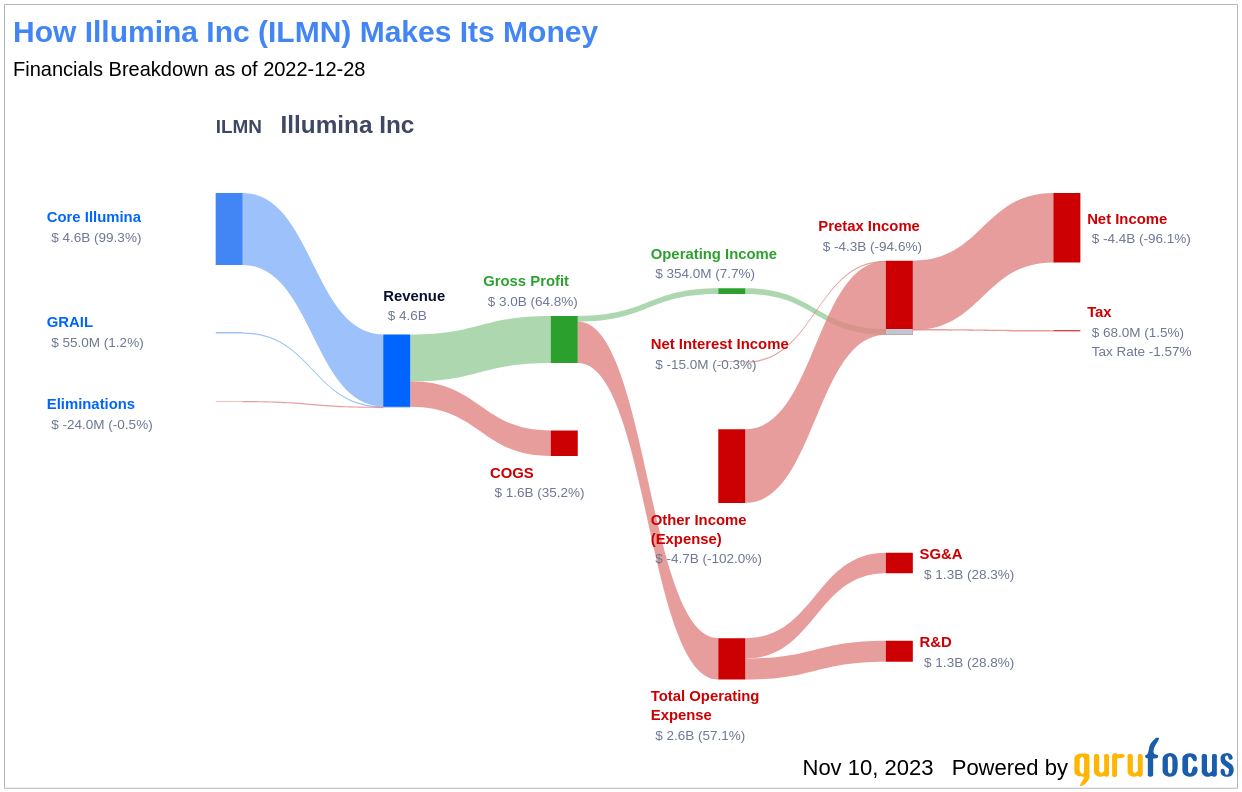
Illumina Inc (ILMN, Financial) specializes in genetic analysis tools and services with applications in life sciences and clinical labs. The company is a leading provider of sequencing instruments, consumables, and services, accounting for about 90% of its revenue. Its technology is pivotal for whole genome sequencing and other genomic applications. Illumina also offers microarrays, contributing to around 10% of its sales, for genetic screening in consumer and agricultural markets. This snapshot of Illumina's operations sets the stage for a deeper dive into the company's financials in relation to its stock price and GF Value.
Illumina's Low Altman Z-Score: A Breakdown of Key Drivers
Examining Illumina's financial ratios that contribute to its Altman Z-score reveals a concerning trend. The Retained Earnings to Total Assets ratio has declined from 0.36 in 2021 to 0 in 2023, indicating a reduced ability to reinvest or manage debt. Additionally, the EBIT to Total Assets ratio shows a downward trend, suggesting decreased operational efficiency. The asset turnover ratio's decrease from 0.45 in 2021 to 0.39 in 2023 further implies that Illumina is struggling with utilizing assets to generate sales, a sign that may point towards a value trap.
Conclusion: The Value Trap Potential of Illumina
When the allure of a seemingly undervalued stock like Illumina Inc (ILMN, Financial) tempts investors, it's crucial to look beyond surface-level metrics. The company's low Altman Z-score, declining financial ratios, and concerning Piotroski F-score collectively suggest that Illumina could be a value trap. The discrepancy between its current stock price and the GF Value may not reflect a bargain but a warning. Prudent investors should exercise caution and conduct extensive research before considering Illumina as a part of their investment portfolio.
GuruFocus Premium members can discover high-scoring investment opportunities using our Piotroski F-score screener and Walter Schloss Screen for stocks with high Altman Z-Score.
This article, generated by GuruFocus, is designed to provide general insights and is not tailored financial advice. Our commentary is rooted in historical data and analyst projections, utilizing an impartial methodology, and is not intended to serve as specific investment guidance. It does not formulate a recommendation to purchase or divest any stock and does not consider individual investment objectives or financial circumstances. Our objective is to deliver long-term, fundamental data-driven analysis. Be aware that our analysis might not incorporate the most recent, price-sensitive company announcements or qualitative information. GuruFocus holds no position in the stocks mentioned herein.