

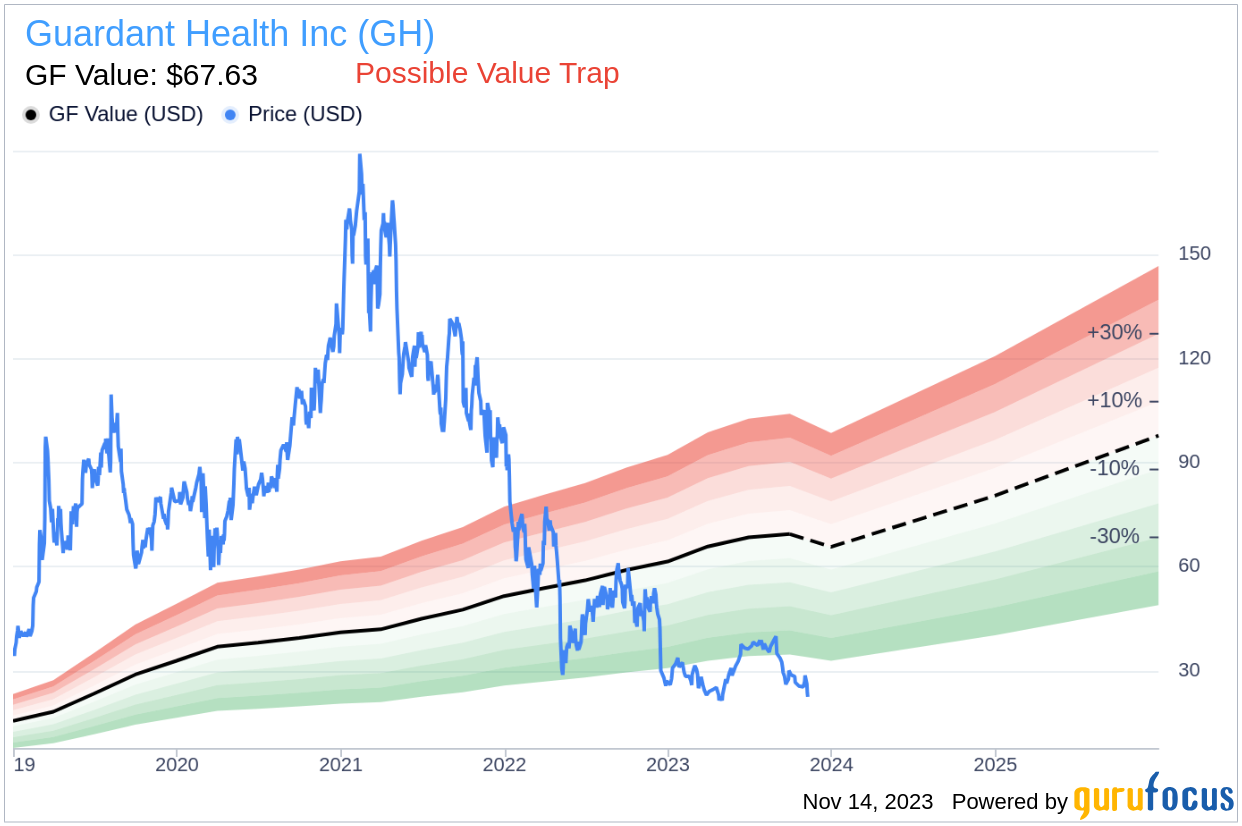
Value-focused investors are constantly scouring the market for undervalued stocks that may lead to significant returns. Guardant Health Inc (GH, Financial) has recently caught the attention of many, with its stock price at $22.63, reflecting a daily increase of 4.87% and a 3-month decline of 36.41%. The GF Value of the stock is estimated at $67.63, suggesting a potential undervaluation. But is this an opportunity, or is Guardant Health a classic example of a value trap?
The concept of GF Value is central to our analysis. It is an intrinsic value estimate, based on historical trading multiples such as PE, PS, PB Ratios, and Price-to-Free-Cash-Flow, adjusted for the company's past performance and expected future business outcomes. If a stock trades significantly below this line, it may indicate a higher future return, while trading above suggests overvaluation and potential poor returns. Guardant Health's current price, in contrast to its GF Value, raises questions about its true worth.
However, investors must dig deeper than surface-level valuations. Guardant Health's financial health, as indicated by its low Altman Z-score of -0.29, raises red flags about its stability and potential as a value trap. The Altman Z-score, a measure predicting bankruptcy risk, combines five financial ratios to produce a score indicating financial distress. A score below 1.8 is concerning, and Guardant Health's score is well below this threshold.
Understanding Financial Health Indicators
The Piotroski F-score is a nine-point scale used to evaluate a company's financial robustness, with higher scores indicating stronger financial health. Guardant Health's low F-Score suggests potential financial weaknesses that investors should be wary of.
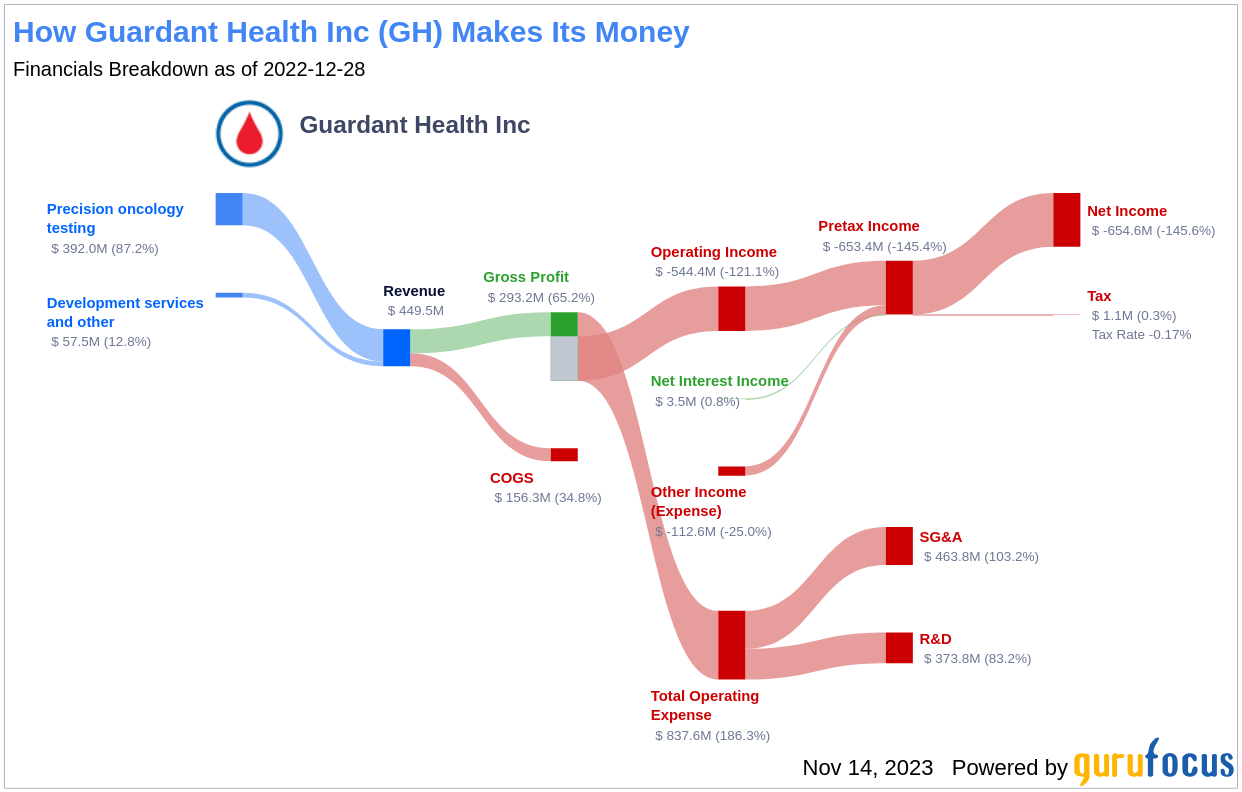
Guardant Health's Business Overview
Guardant Health, based in Redwood City, California, is a pioneer in liquid biopsy tests for cancer, with a range of products for clinical and research use. The company's recent launches, such as Reveal for molecular residual disease testing and Shield for colorectal cancer screening, reflect its innovative edge. Despite these advancements, there's a discrepancy between the company's stock price and its GF Value, warranting a closer examination of its financial health.
Breaking Down the Altman Z-Score Components
Guardant Health's financial distress signals are partly due to its negative trend in Retained Earnings to Total Assets ratio, moving from -0.41 in 2021 to -1.09 in 2023. This decline suggests a reduced ability to reinvest earnings or manage debt effectively.
Similarly, the EBIT to Total Assets ratio has shown a downward trend, from -0.18 in 2021 to -0.24 in 2023, indicating a potential underutilization of assets to generate operational profits. These factors contribute to the company's low Altman Z-score and the impression that Guardant Health may be a value trap.
Is Guardant Health a Value Trap?
Considering the combination of Guardant Health's low Piotroski F-score, negative Altman Z-score, and declining financial ratios, the evidence points towards the stock being a potential value trap. The attractive pricing relative to GF Value may lure investors, but the underlying financial health of the company suggests that caution is necessary.
For those seeking to avoid such traps, GuruFocus Premium members have access to tools like the Piotroski F-score screener and the Walter Schloss Screen, which can help identify stocks with stronger financial indicators. In the case of Guardant Health, while the company shows promise through its innovative offerings, its financial metrics suggest that investors should proceed with caution.
Is the current price point of Guardant Health an opportunity for value investment, or is it a siren song leading towards a value trap? This is the question that investors must carefully consider.
This article, generated by GuruFocus, is designed to provide general insights and is not tailored financial advice. Our commentary is rooted in historical data and analyst projections, utilizing an impartial methodology, and is not intended to serve as specific investment guidance. It does not formulate a recommendation to purchase or divest any stock and does not consider individual investment objectives or financial circumstances. Our objective is to deliver long-term, fundamental data-driven analysis. Be aware that our analysis might not incorporate the most recent, price-sensitive company announcements or qualitative information. GuruFocus holds no position in the stocks mentioned herein.