

Caleres Inc (CAL, Financial) recently experienced a notable daily gain of 8.84%, complementing a 3-month gain of 13.02%. With an Earnings Per Share (EPS) of 4.13, investors are keen to understand whether the stock is accurately valued. The central question is: Is Caleres modestly overvalued? The following analysis delves into Caleres' valuation, providing insights into the stock's current market position.
Company Overview
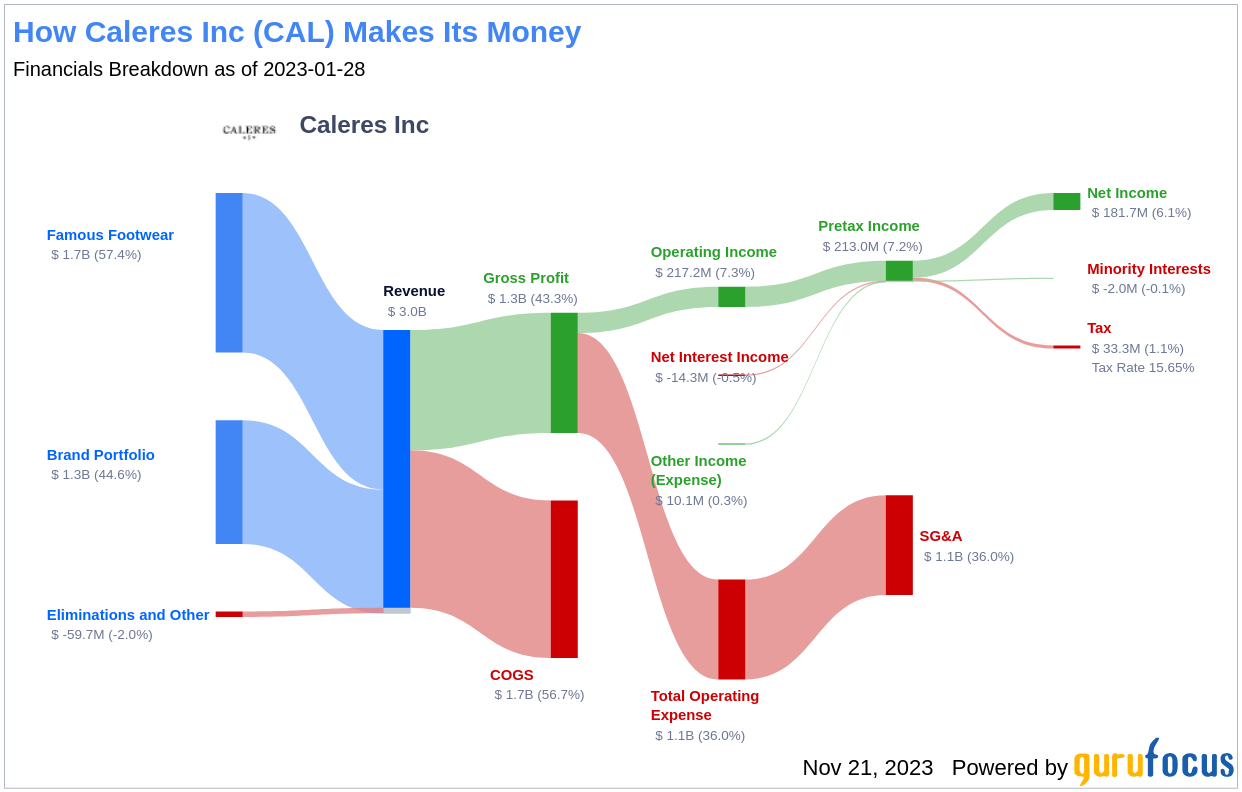
Caleres Inc (CAL, Financial) is a prominent footwear retailer in the United States, with its operations segmented into Famous Footwear and Brand Portfolio. The former includes retail stores and e-commerce platforms, while the latter encompasses wholesale operations that manage a diverse range of footwear brands. A comparison between the current stock price of $29.91 and the GF Value of $26.41 suggests a modest overvaluation. This valuation is crucial for investors seeking to understand the fair market value of Caleres' shares.
Understanding the GF Value
The GF Value is a unique measure of intrinsic value, incorporating historical trading multiples, a GuruFocus adjustment factor, and future business performance estimates. The GF Value Line indicates the stock's ideal trading value. When a stock's price significantly surpasses the GF Value Line, it's considered overvalued, potentially leading to poor future returns. Conversely, prices below this line may signal undervaluation and the possibility of higher returns. Currently, Caleres (CAL, Financial) is perceived as modestly overvalued, which could imply lower future returns relative to the company's business growth.

Link: These companies may deliver higher future returns at reduced risk.
Financial Strength
Assessing a company's financial strength is vital to avoid the high risk of permanent capital loss. Key indicators such as the cash-to-debt ratio and interest coverage provide insight into this area. Caleres has a cash-to-debt ratio of 0.06, ranking lower than 87.72% of its peers in the Retail - Cyclical industry. With an overall financial strength rating of 5 out of 10, Caleres exhibits fair financial health.

Profitability and Growth
Investing in profitable companies, particularly those with a track record of consistent profitability, is generally less risky. Caleres has shown profitability over 7 of the past 10 years. With a revenue of $2.90 billion and Earnings Per Share (EPS) of $4.13 over the last twelve months, its operating margin stands at 6.43%, outperforming 64.43% of the industry. The profitability rank of 6 out of 10 reflects a fair status.
Regarding growth, companies that expand at a faster rate often generate more shareholder value, particularly when the growth is profitable. Caleres' average annual revenue growth is 13.8%, which is quite competitive within its industry. However, its 3-year average EBITDA growth is 0%, indicating room for improvement.
ROIC vs. WACC
An effective way to gauge profitability is by comparing a company's Return on Invested Capital (ROIC) with its Weighted Average Cost of Capital (WACC). Caleres' ROIC over the past 12 months is 10.95%, exceeding its WACC of 7.11%, indicating that the company is creating value for shareholders.

Conclusion
In summary, Caleres (CAL, Financial) is currently estimated to be modestly overvalued. The company's financial condition and profitability are fair, but its growth could be more robust compared to its industry peers. For a more comprehensive understanding of Caleres' financials, interested investors can explore its 30-Year Financials here.
To discover high-quality companies that may deliver above-average returns, please check out the GuruFocus High Quality Low Capex Screener.
This article, generated by GuruFocus, is designed to provide general insights and is not tailored financial advice. Our commentary is rooted in historical data and analyst projections, utilizing an impartial methodology, and is not intended to serve as specific investment guidance. It does not formulate a recommendation to purchase or divest any stock and does not consider individual investment objectives or financial circumstances. Our objective is to deliver long-term, fundamental data-driven analysis. Be aware that our analysis might not incorporate the most recent, price-sensitive company announcements or qualitative information. GuruFocus holds no position in the stocks mentioned herein.